It’s amazing how many George S. Duncans were in the world. And when I thought this Duncan was a reverend, there are a couple of Rev. George S. Duncans of Scottish decent. Thankfully the land records gave away his middle name and named his wife so that helped narrow things down.
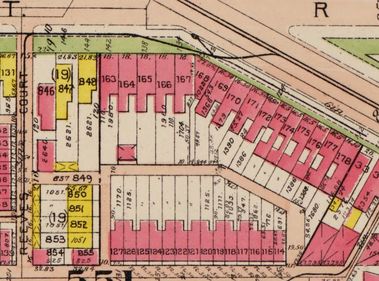
George Stewart Duncan (3/2/1860-1946) and his wife Florence W. Duncan (1872-1949) owned several lots on Square 551. They owned Lot 16, which appears to include Lots 838 to 843, and Lots 30, 31, 32 and 840. They lived at 2900 7th St NE, not in Truxton Circle. His main profession was that of a minister and later he became an instructor at American University in Tenleytown. If I have the right Rev. George S. Duncan he is buried in Rock Creek Cemetery.
I’ve gone through an abnormal name change, so it could be karma should some future historian try to follow me. George S. seems to also be a George L. Duncan, as he has the same birthday. He’s gone through more than one wife as he is married to both a Florence and a Georgie Dennison both of New York state. Georgie was about 6-7 years older than George, and Florence was a younger model by 12 years. And they all lived on 7th Street NE.
Lot 32 went through an address change. According to Document #1936027307 it used to be 1619 3rd Street NW, and became 1633 3rd Street NW. It seems when the Duncans bought the property in 1924 it was 1619. By the time they did something (I am unsure how to interpret these documents) in 1936 with Mrs. John R. Hall (Martha K. Perry Hall) the address had changed to 1633 3rd St NW. With Square 511 having a different layout after the 1970s, this hints to trying to tie lots with addresses, difficult. It appears that they sell it (all the lots) in 1941.
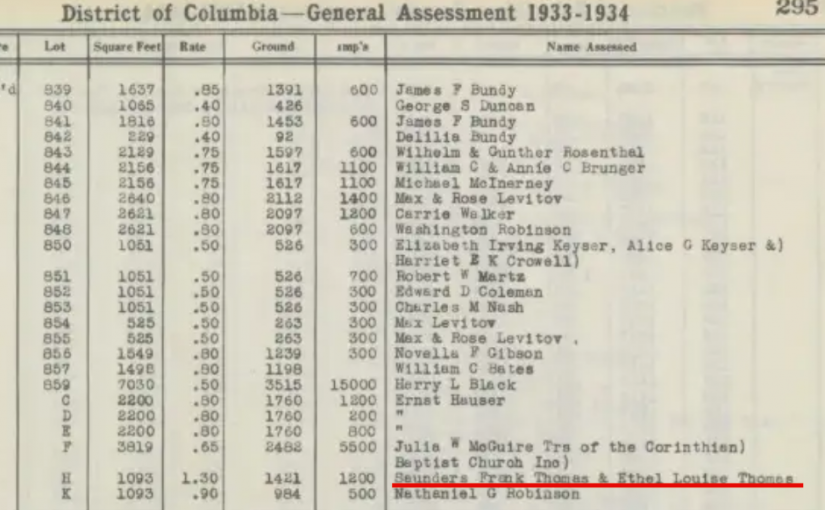
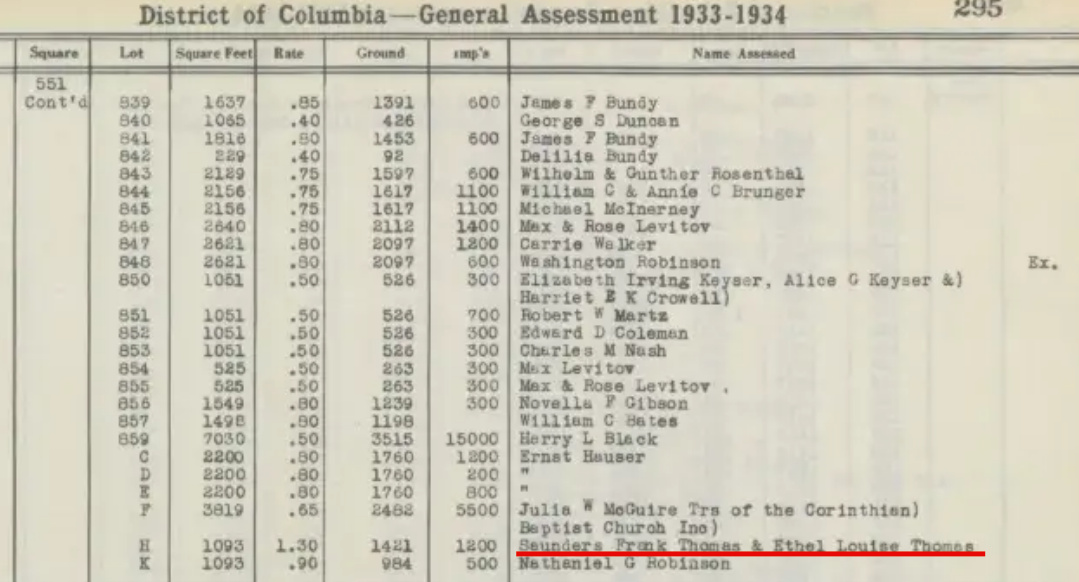 I guess the reason why I am confused by the property documents are how they line up, or don’t, with the census records. So in 1930 the previously mentioned John and Martha Hall lived at 1633 3rd St NW and were listed as owners. But in the 1933-1934 Real Property Assessment (click on the image to see a larger sized item) has Rev. Duncan as the assessed party or owner. The documents between the white Duncans and the African American Halls range from 1924 to 1941. What was going on? I have no idea.