Sq. 507- What a difference a decade makes 1920 vs 1930

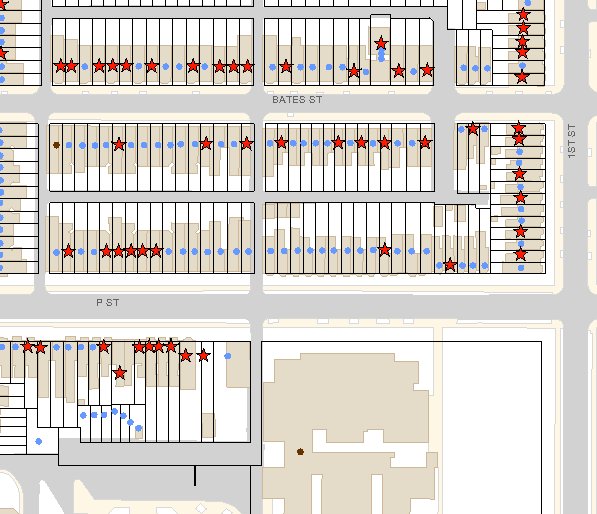
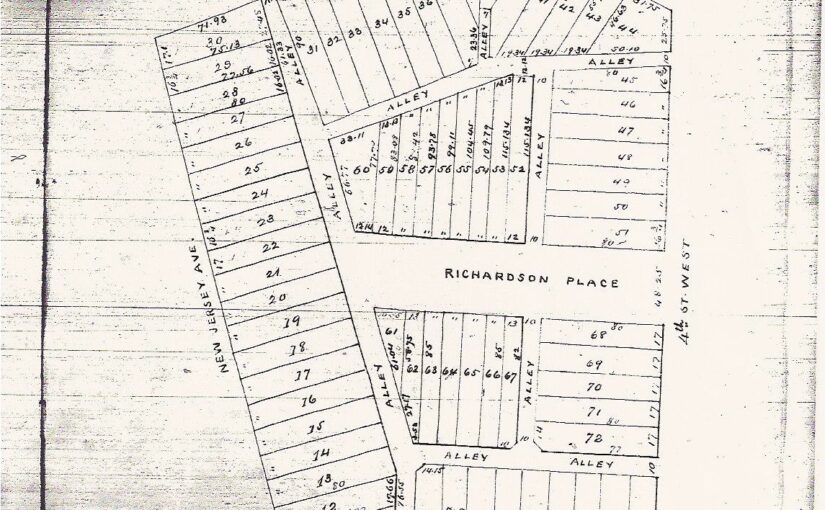
One of the things I noticed with the change in Truxton Circle from 1920 to 1930, was that the neighborhood went from being a racially mixed neighborhood to being a predominately African American neighborhood. One of the places where this change was obvious was on square 507, along the 1700 block of New Jersey Avenue NW.

A stretch of the block that was 100% white in 1920:

1700 blk New Jersey Ave NW, 1920. Orange= White residents; White= No data

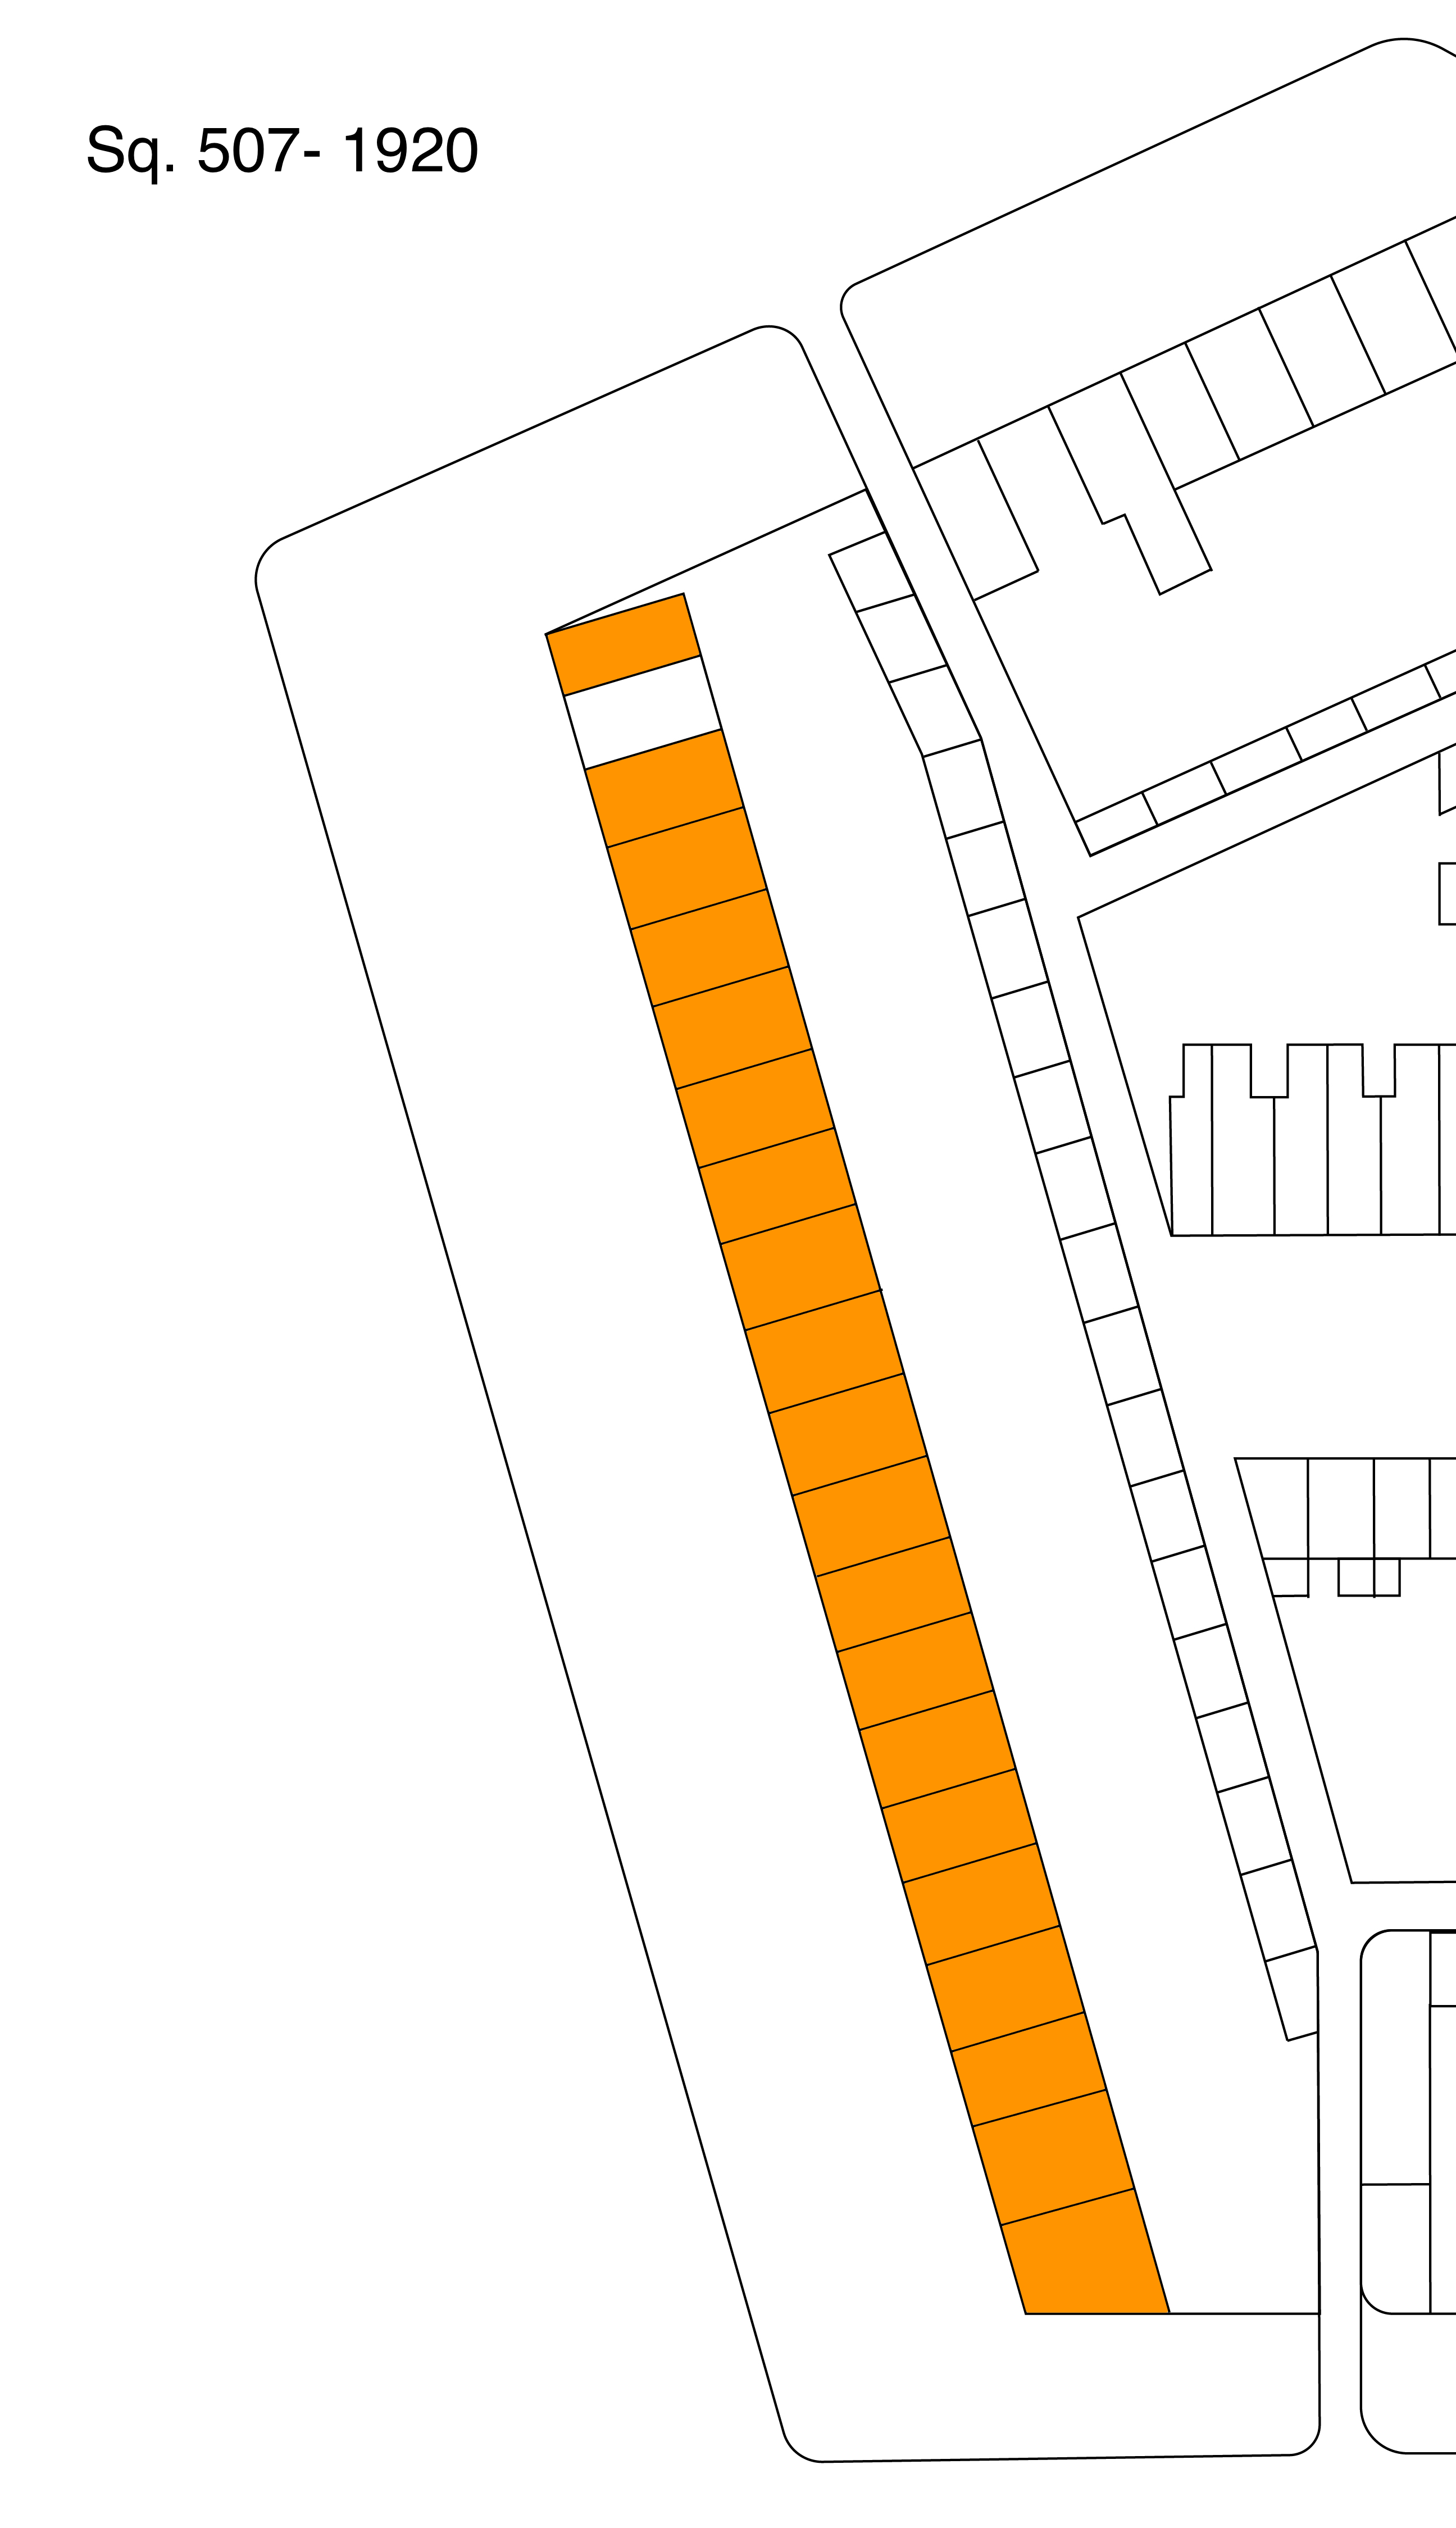
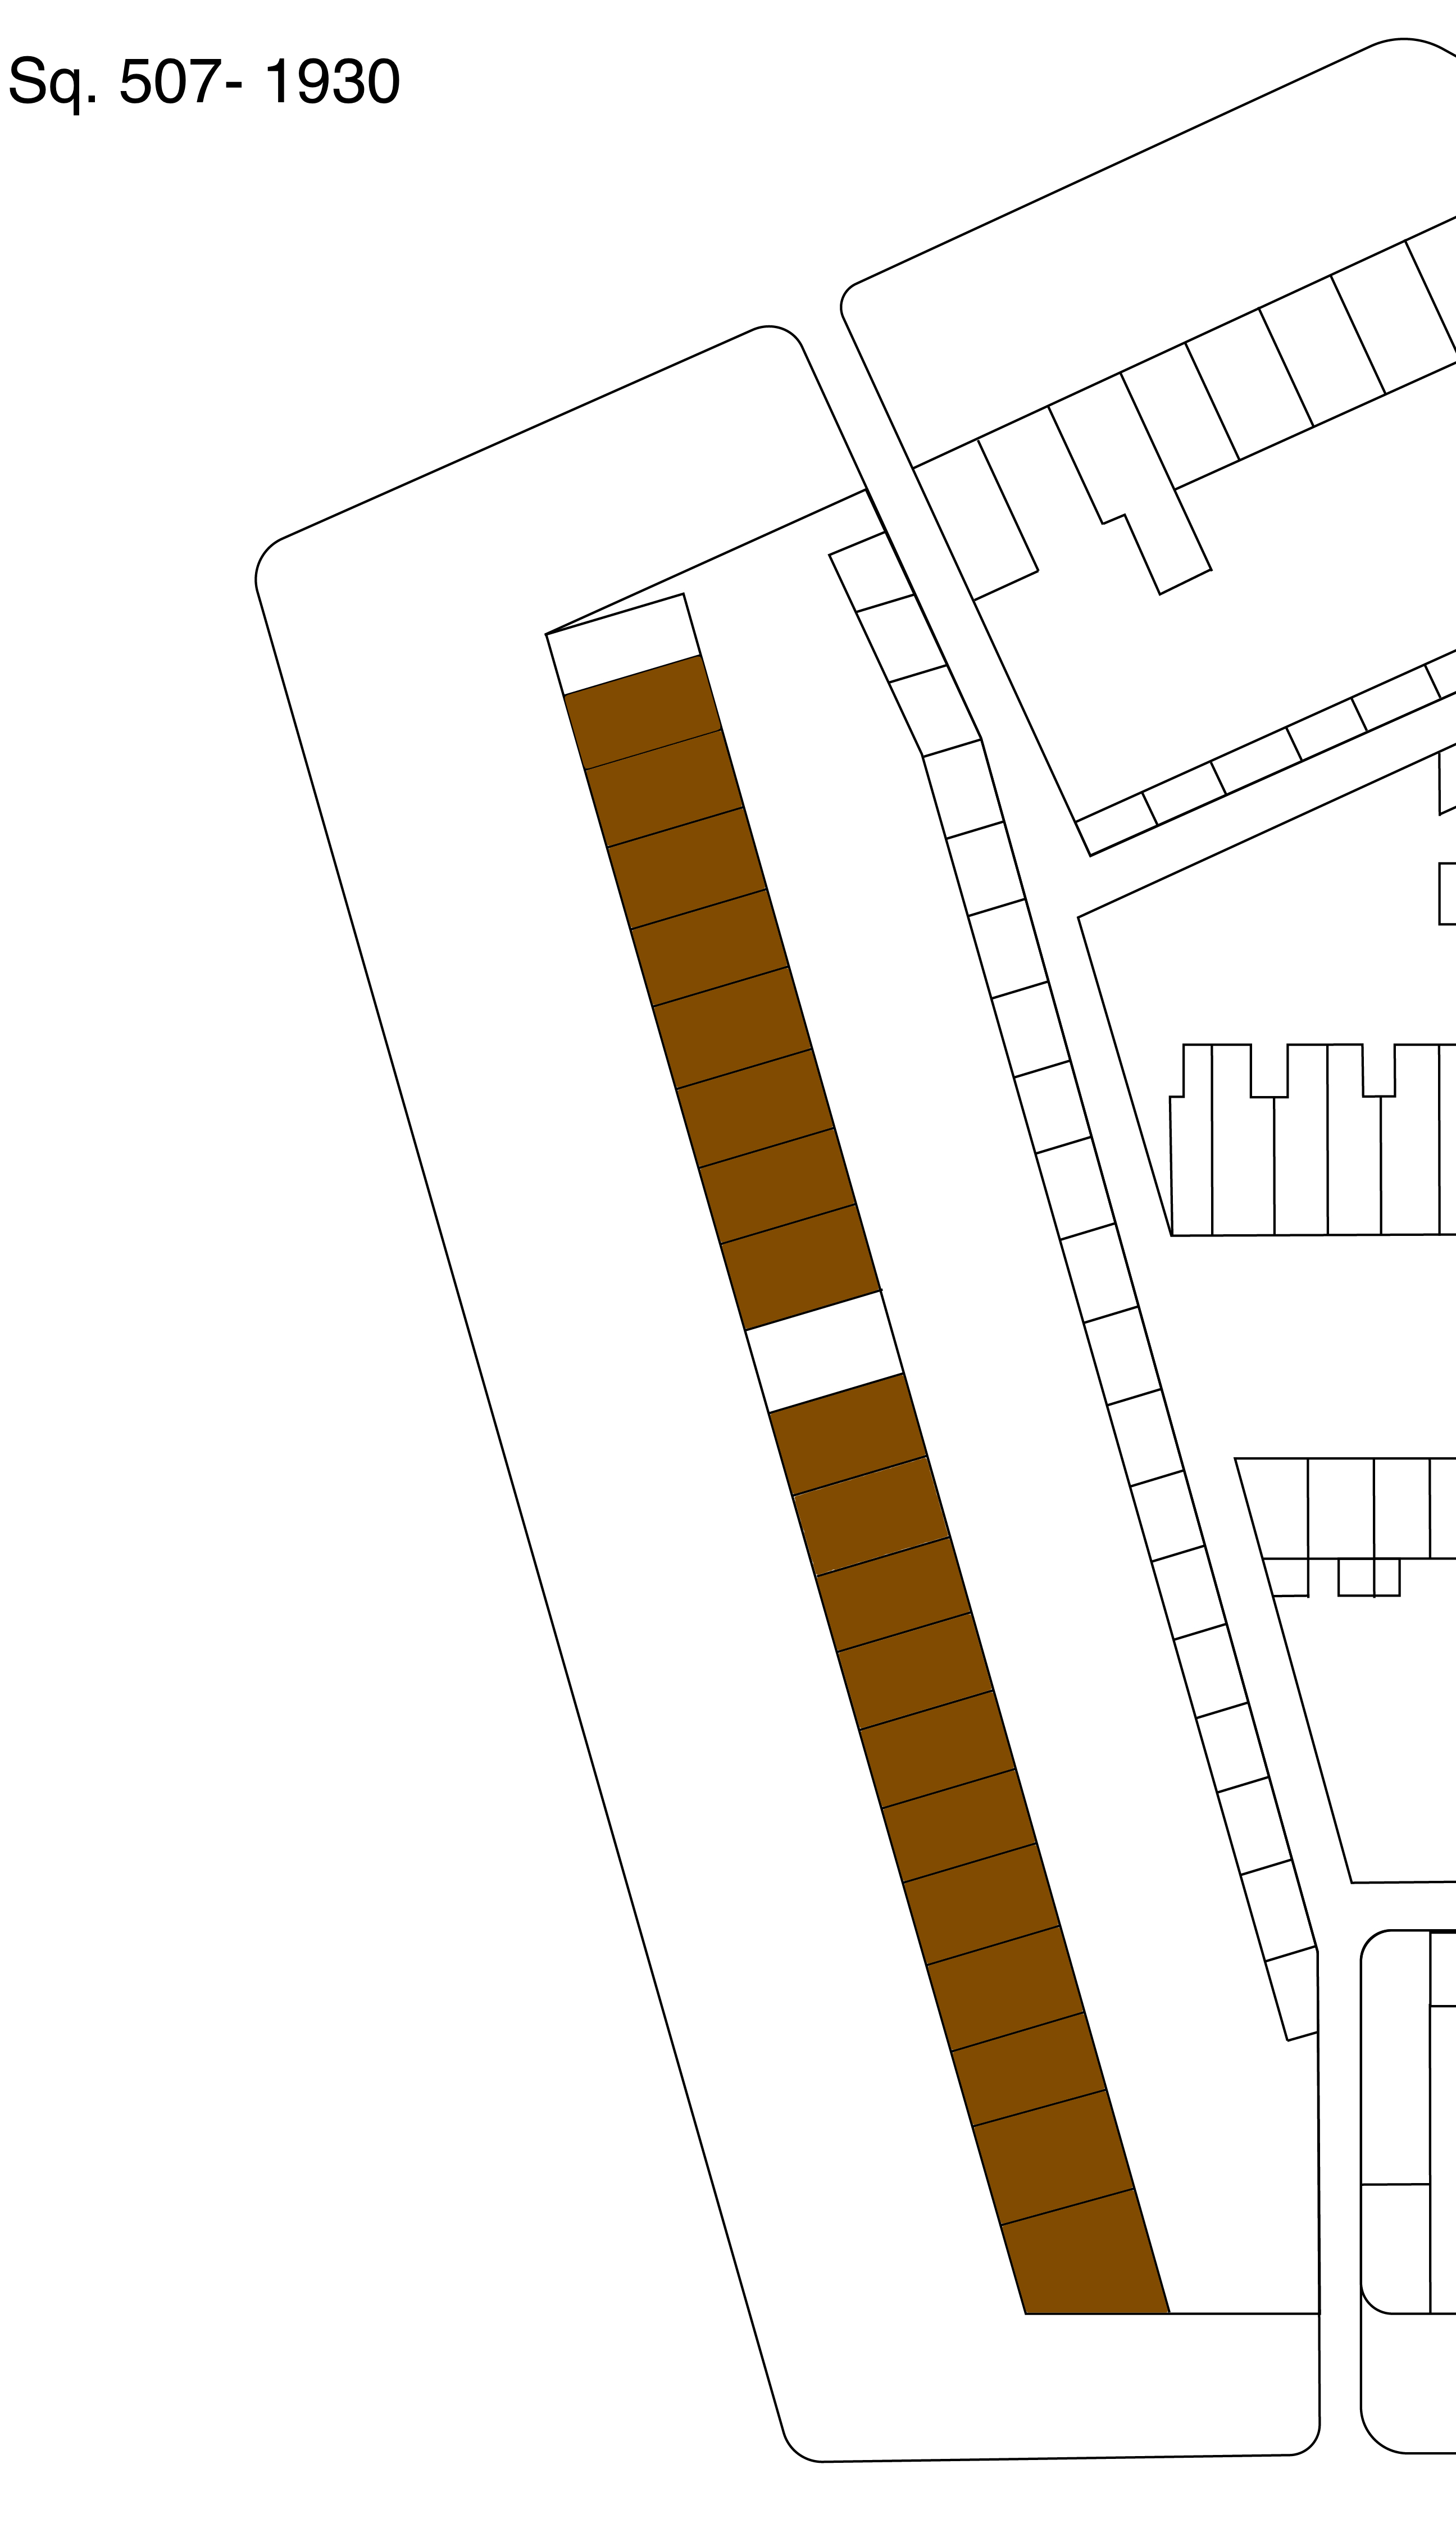
…became 100% African American in 1930:

1700 Block NJ Ave NW, 1930. Brown= AfAm residents; White= No data

I wondered why and looked for a reason. The reason may be buried among some of my old posts that I have yet to uncover and repost. I have some gaps between April 2010 and December 2013, and somewhere in there is a post, I swear, about a woman who lived on the block with her sons and I traced them to 1930. By that time Rosalie Flynn (maybe her name, maybe not) had either moved to Virginia or died and one of her sons had moved to the Atlanta area, married and was a lawyer.

So the reason for why one white household left the neighborhood was that people move on.

Many of you are not in the same place you were 10 years ago. A census is every 10 years. People grow up. They get married. Their career takes them to another city or town or even country. Some die. In urban areas, like Washington, DC, people are always moving around.


Truxton Circle Population 1880-2010

So I was cleaning up and found this and decided to post this helpful table.

Truxton Circle Population 1880-2010
Year Total Black White Other/Asian Note
1880 1511 678 832 0
1900 4723 2438 2281 4
1910 6801 2232 4565 4
1920 7234 3008 4221 6 4-Chinese
1- Japanese
1- White/Chinese
1930 6175 4455 1712 6 All Chinese
1940 8244 6519 1718 4 Note: 3 Japanese
1 Chinese
Total also 8244
1950 7720 6186 1511 23
1960 6789 6716 58 15
1970 5830 5768 21 41 2 yrs post riot
1980 3349 3249 61 39
1990 3623 3347 189 87
2000 2997 2713 103 181
2010 3028 1964 816 248

Source: US Census


2010 Census Take II

I got a second census form in the mail yesterday. I guess I didn’t send in the first one quickly enough. Though I got the first form a good while ago, I waited because I honestly did not know who was going to be living with me April 1st. Was it going to be my cousin or a roommate or nobody. Well as soon as I got back from my Florida vacation my cousin left and returned to the housing farm of upper PG County to be with her parents. My roommate, who I didn’t know I was going to have until a week before his move in (he’s a returning roommie so all the background checks were done before), arrived shortly after she left. Census wants age and date of birth, and though it is on an application somewhere, lost in a pile somewhere in the house, I figure it is just easier to ask the second occupant of the house to fill that part out. So a few days before the 1st I asked him to fill out his portion and I mailed it back.
Now I got another form sitting in the living room. Apparently, according to the Census blog, it is a replacement form and I can disregard it.

2010 Census- Count your roommate

At Monday’s BACA meeting there was someone from the Census trying to educate us about the census and census jobs. But a very telling question came from the citizenry, do you count the student/intern/ roommate on the same form. YES. This is not like taxes. If you’re all under the same roof, in the same unit, you are a household. So pick someone as the head, and the rest of you roommates (and couch surfers who have failed to chip in) get listed as “roommate”. You can go old school and call yourselves “boarders” or “roomers” as how you’re related to the head.
Also don’t worry about over counting, as there are a bunch that will be undercounted, so if your roommate’s boyfriend spent April 1 over at your pace, list him too.

Truxton Circle- People and a lost traffic circle

If you haven’t seen it arleady Left for LeDroit has a post on the Truxton Circle and how you can still find it’s outline today.
And I think I can say I can now start the writing portion of Truxton Circle 1900. I cleaned up a lot of data, deleted addresses that you’d think were in the study area, but aren’t and tracked down people for whom some enumerators were too drunk to write down their addresses. When I started out whites outnumbered black residents by a smidgen. With the data clean-up and address removal, blacks outnumber whites by a smidgen and I still have 4 Chinese guys.
There was this one fellow, Paul Pearson, of 218 N Street. He was a white DC born Druggist, who lived with his Maryland born wife, Emma, and owned his home free and clear. According to the 1899 city directory he worked at 500 New Jersey Avenue NW. The National Association of Realtors building sits where his workplace sat. Considering where his home and work were located he must of had a pretty good commute. And if memory serves me right there was a streetcar nearby that could have taken him straight there.

Don’t fill out 2010 Census forms drunk

This year is when we will get the 2010 Census in the mail or if you don’t get it or fill it out, census takers will come to your door. Anyway, my cousin has completed the 1900 census for the Truxton Circle area and I still got to mash the data up, clear out the non-addresses, and decide what kind of paper I want to write. The last enumeration district she had to do, was ED 63, and according to her complaint, the dude who was the census taker must have been drunk. Since it is 1900 I will concur on the drunk part, and not chalk it up to crack. The census taker’s work was sloppy, disjointed, and simply disorganized. We imagine that he was staggering around eastern Mt. Vernon Square area asking random passersby where they lived.
Maybe he kept stopping by bars. I don’t know about the number of saloons or bars in the TC area circa 1900 but apparently a lot of the Irish that were captured in our study were barkeeps. Yes, I know that just goes right into a stereotype. What can I say, our data has stereotypes. Don’t blame us, blame the occupational landscape for Irish, and African Americans for 1900.
Back to our drunken census taker, he has made trying to clean up the data hard, and there will probably be some holes. So for the sake of any future researcher in 2090, please write clearly with a clear head, when you fill out your 2010 census form.
Thank you.

SQUEEEE!!!! Census data

Ah, the best use of an unemployed college graduate and a spare room. I hired my cousin to do some data entry on the 1900 census and she has just completed enumeration district 64, which is the northern part of the TC. Enumeration District 64 (ED64)goes from the 1400 block (odd #) of NJ to the 1700 block, Florida and Rhode Island Aves, 1st St, to Q and O Streets. I immediately tossed the Excel worksheet into an Access database and created a query about working women. Now I’m still getting used to the updated MS Access program and can’t seem to figure out how to exclude women “at school”. Women over the age of 15, 595 of them had some occupation. Of those 595 women, 473 were black. In 1900 the TC north African American women were laundresses, nurses (child and sick), house servants, and cooks. White working women were saleswomen, teachers, house keepers, landladies, office workers, and seamstresses.

Disclaimer-
To clarify, my census project is sponsored personally by me. I get moral and other minimal support from my employer, as it sort of falls under professional development. Secondly, this is NOT a building or house history project. Things like houses are secondary, people are more interesting. I have no intention of putting the raw data on-line. For one, it’s too much. ED 64 is over 2,500 names alone, and there are 3 other EDs to go. I do hope to go on to census years 1910-1930. However the rate we’re going I’ll probably get through to 1910 or 1920.

Turnover part 2

This map is of houses sold on these few blocks between 1999 and this year below $500K. There are still plenty of red stars representing sales. The blue are more than likely houses that sold prior to 1999, or the odd property selling at $500K and above. Since I did throw in the more than $500K on the map (not shown) it seems there were a few but not many. Comparing the map from Turnover part 1 to this one, a majority of the 1999-2009 sales were less than 1/2 a mil.
Yet the thing that I find really interesting is not so much the amount houses finally sell for, but the fact there are so many houses that change hands in a 10 year period. It seems to reflect the transient nature of DC or the investor fueled real estate boom of the 2000s.
Let’s say, for the most part, that the blue dots represents long timer residents and the red stars newer residents. It isn’t perfect, as the blue dots could be rentals that turn over every couple of years but never sold, and red stars rentals bought by new investors that remain rentals. On my own block one of the red stars was a rental home that the renters later bought from the owner. But anyway let’s say those red stars represent new blood on the block, in some spots, except that part of the 100 block of P, there is a fair amount of turnover.
If you get on the DC gov website and play with the DC Atlas for Real Property and compare and contrast with other parts of the city regarding final sale prices (which sometimes isn’t the listing price) and turn over, it’s interesting.

Turnover part 1

This was originally posted in 2009. I am revisiting some older posts and reposting them with commentary. This is just a test run.

Re-reading this I see that I did not understand some quirks of real estate, such as when you wind up transferring a property to yourself. This happened to me when I finally got my spouse on the deed. For some odd reason I had to transfer it to myself too.

Simply said, there is turn over. There was plenty of owner turnover, or it appeared so, in the wild years of early gentrification between 1999 and 2009.

————————————————————-

This was stolen off of the DC government’s DC Atlas website and what it shows are houses sold between Jan 1, 1999 and yesterday (Nov 17, 2009). More accurately it shows houses sold for more than $1 and below a billion. I had to throw that in when it showed every house with a red star and I discovered the database had some quirky dates of homes being bought by their longtime owners for 0.00, and had to find a way to exclude that misinformation.
Each red star represents a property sale, that’s it. However, one can make guesses that a majority of those sales resulted in some turn over.

Turnover part 1

I had this sitting in my draft folder. It is from November 18, 2009. Instead of deleting it I’m going to publish it, fourteen years later (6/15/2023).

This was stolen off of the DC government’s DC Atlas website and what it shows are houses sold between Jan 1, 1999 and yesterday (11/18/2009). More accurately it shows houses sold for more than $1 and below a billion. I had to throw that in when it showed every house with a red star and I discovered the database had some quirky dates of homes being bought by their longtime owners for 0.00, and had to find a way to exclude that misinformation.
Each red star represents a property sale, that’s it. However, one can make guesses that a majority of those sales resulted in some turn over.