
I had this sitting in my draft folder. It is from November 18, 2009. Instead of deleting it I’m going to publish it, fourteen years later (6/15/2023).
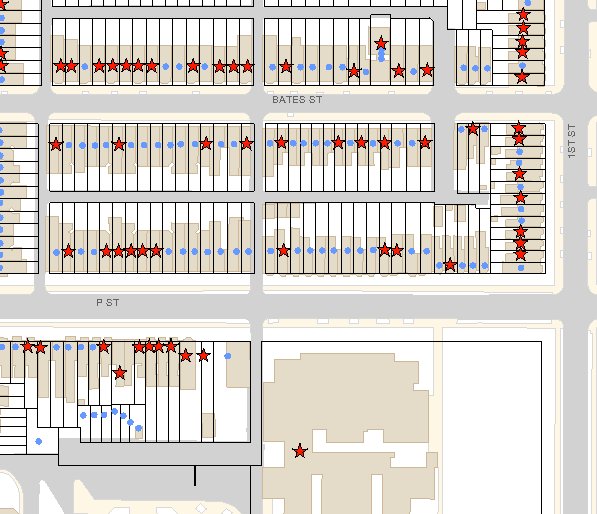 This was stolen off of the DC government’s DC Atlas website and what it shows are houses sold between Jan 1, 1999 and yesterday (11/18/2009). More accurately it shows houses sold for more than $1 and below a billion. I had to throw that in when it showed every house with a red star and I discovered the database had some quirky dates of homes being bought by their longtime owners for 0.00, and had to find a way to exclude that misinformation.
Each red star represents a property sale, that’s it. However, one can make guesses that a majority of those sales resulted in some turn over.