Same old house, new and improved and expensive

A minor irritation I have with some essays on gentrification and housing is a complete failure to acknowledge investment and disinvestment in physical structures.

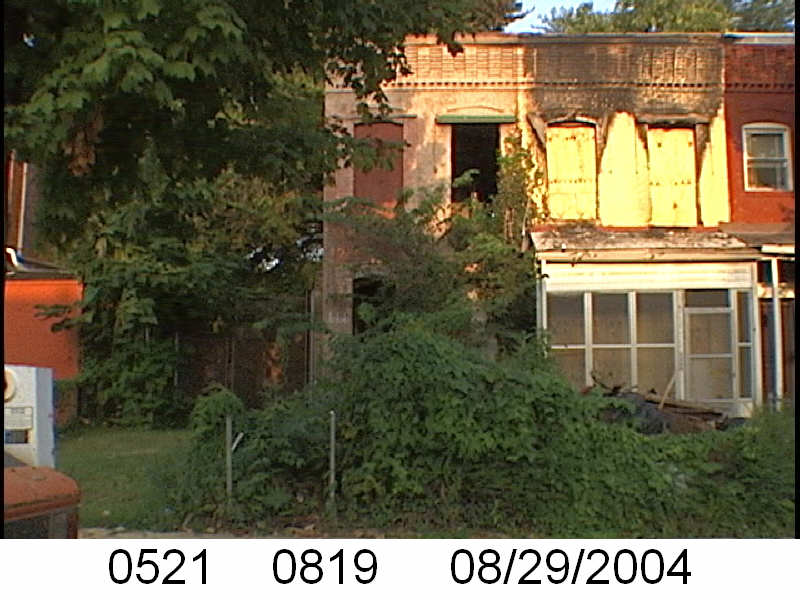
This is an August 2004 PropertyQuest picture of 1504 3rd Street NW. I have an earlier one from 2003.150X3rdSt.jpg

Anyway, it sold in August for $765,000. According to the data on Redfin, it sold in 1991 for $76,750. Between 2001-2006 this shell of a house kept getting listed and delisted. I’m not going to do any in-depth research to determine if it changed hands in that period, but in December 2006 it sold for $250,000. Then in 2007 it sold for about $450K, by this time it had definitely been renovated. This year it came back on the market and sold in the mid $700K range.

When someone takes this house and other houses in the neighborhood and just sees prices, what are they thinking? Do they think the rise in price is just arbitrary and an effort to keep lower-income households priced out?

What I witnessed was investment coming into the neighborhood. That house in 2003-2004 was a shell, unfit for human habitation. That was a result of disinvestment when it wasn’t worth it for the owner to maintain the structure.  Shaw had experienced a lot of disinvestment. After the riots in 1968, many businesses didn’t return. Some residents and landlords just abandoned the neighborhood because it wasn’t worth the money to them to fix the damage.

To take a shell from being unfit to being desirable takes capital, investment. Someone paid to buy cabinetry, flooring, windows, paint, drywall, electrical wires, PVC pipes, HVAC system, framing, appliances, and a roof. Plus the labor to install these things. Having renovated my house and another property, I can say this is not cheap. At the very least $100K went into making the house livable.

Well the house was already renovated by 2007, can I justify the $300K-$400K price hike between 2007 and 2019? I can’t tell if the rear deck was already there, but it was the neighborhood that changed in the period that made it more valuable. What happened between 2007 and now? Big Bear, a few blocks away opened up. Then the Bloomingdale Farmers Market about a year later. Nightly gunshots became less of a thing. There are a handful of sit down restaurants within walking distance, 3 that have had or have Michelin mentions. Two with 1 Michelin star within, biking…longer walking distance. Also, other houses in the neighborhood have been renovated and owners have a financial incentive to maintain their properties. But does that justify the price increase? How much is a safer (2019 TC is way safer than 2004 TC) neighborhood worth? How much is it worth to have places to take friends/dates that are a nice stroll back to your place? Schools have improved, and as a parent, it is worth a few thousand to have a plethora of Pre-K choices in walking distance.  As a homeowner, there is a disappointing difference between what you can refinance and what is a possible sales price. The improvements in the neighborhood have allowed us to refinance the house to fix it up, but the value to bank says the house is worth was much, much lower than what was selling around us. But all that is meaningless if all you care about is keeping the price of housing down.

Lies, Damned Lies, and Statistics: Various reasons for ‘gentrification’ that you don’t want to hear

This is old, but the data I needed was buried in a file. The Institute on Metropolitan Opportunity- University of Minnesota Law School put out a study that was reported on by the Washington Post and DCist. The 7-page study is general and I have no beef with it, but its is the interactive map that has me questioning it.

Truxton by the numbers
I might not know the US in general but I sure as heck know Truxton Circle. Let’s look at the study’s numbers for the change from 2000 to 2016 by race:
Asian: 110
Black: -1232
Hispanic: 34
White: 926

Let’s look at my numbers for 1970 to 2010

Year Total Black White Latino/Asian/ Etc
1970 5830 5768 21 41
1980 3349 3249 61 39
1990 3623 3347 189 87
2000 2997 2713 103 181
2010 3028 1964 816 248

The trend since 1970 was downward for everyone, mainly African-Americans since they/we were slowly departing the neighborhood. So the -2,519 of the Black population in Truxton Circle from 1970 to 1980, can we also call that displacement? It’s much bigger than the loss of 1,232 from 2000 to 2016. Now I’ll acknowledge a bump in populace from 1980 to 1990 of almost 300 people, but apparently by 1990 they several hundred said ‘screw this’ (or got shot) and left in droves by 2000. The 00s had numbers so low, I think those numbers hadn’t been seen since the 19th Century when vast swaths of land were undeveloped.

The loss of Afro-American residents from 2000 to 2010 was 749. The study map has it from 2000 to 2016 down by 1232, so an extra 483 left between 2010 and 2016. There is a trend, prior to gentrification of fewer and fewer Black residents.

Whaddya want White Flight. Again?
Let’s expand that table, shall we? Apologies for not having the Black population for 1940.

Year Total Black White Everyone Else
1940 8244 ….. 1718 ….
1950 7720 6186 1511 23
1960 6789 6716 58 15
1970 5830 5768 21 41
1980 3349 3249 61 39
1990 3623 3347 189 87
2000 2997 2713 103 181
2010 3028 1964 816 248

In 2016 the white population should have crested above one thousand, but still not at 1940s or 1950s levels. So let’s say trends continue and the white population continues to grow, maybe getting back to 1950s levels. You know what happened to DC whites after 1950? They began to leave the city in droves, as did TC whites. So when in complaining about the growing the white population, is it a request for white flight?

Various reasons for demographic changes
Demographic changes, aka gentrification. The narrative is that it is displacement. So I return to my question about the loss of 2519 blacks in 1980, was that displacement? Maybe. Was it gentrification? Probably not. Was it crack? That would explain a loss between 1980 and 1990, but there wasn’t a decline. Thinking of my own block I can think of various reasons for the demographic change between 2000 and 2016.

Fewer Section 8s- Or Housing Choice Vouchers or whatever you want to call it, but aka Section 8. There were a few suspected Section 8 houses around, two on my block owned by one fellow who seemed to have gotten into financial trouble and had to sell them. The new owners did not keep them as Section 8, but lived in them a short while and rented them out at market rate. Fewer landlords are chasing Section 8 renters, when the area attracts market-rate renters. And there are accidental landlords (former resident homeowners) who are not savvy or interested in the voucher program.

Not a one to one exchange- My next door neighbors, 2 white men, bought their house from a black family of 5 (mom, dad, two kids, and grandpa). Units that had larger families got replaced by singles and childless couples.

Not enough middle-class Black people moving in- Think of the population from year to year as a river of water that is fed by tiny little streams. As low-income African Americans moved out they’d be replaced by other low-income AfAms. However, this flow is blocked by the loss of low-income rentals in favor of mixed-income and luxury rentals and for sale housing. The city government is more likely to increase low-income housing in areas where property is cheap, so not here. But if the goal is racial diversity, then middle-class Black families would need to stream in. However, there aren’t enough middle-class Black households interested in moving into the urban core. Also, programming targeted at AfAms are more interested in having low-income Blacks as clients, as opposed to creating strong, independent middle-class Blacks.