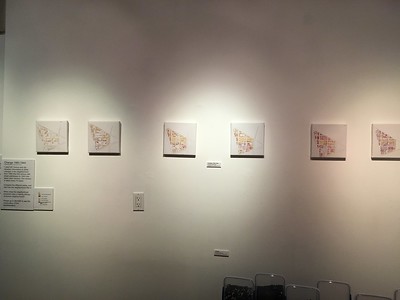
Back in 2017, I and two artist neighbors set up an exhibit at 410 GoodBuddy called The Triangle Known as Truxton Circle. I have a few things sitting on my computer from the exhibit that I’d like to share. Between no childcare and attempting to telework in less than ideal conditions, yes, I’m not posting much. But I can post this from the exhibit.
BEANS!
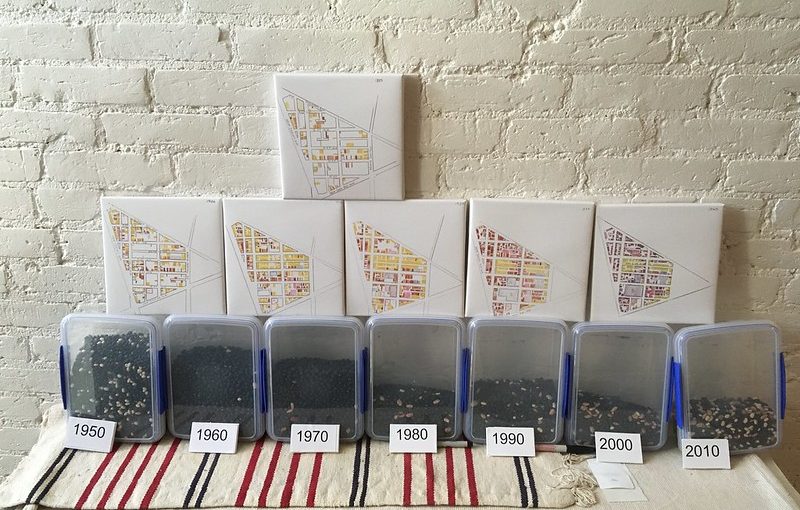
2016, Mixed MediaThis picks up where Change 1880-1940 leaves off. Each bean represents a single person. Each container represents a census year. Each year is different.
Compare the different years.
What is going on here?
Why do you think some years have more people than others?
The neighborhood continues to transform.
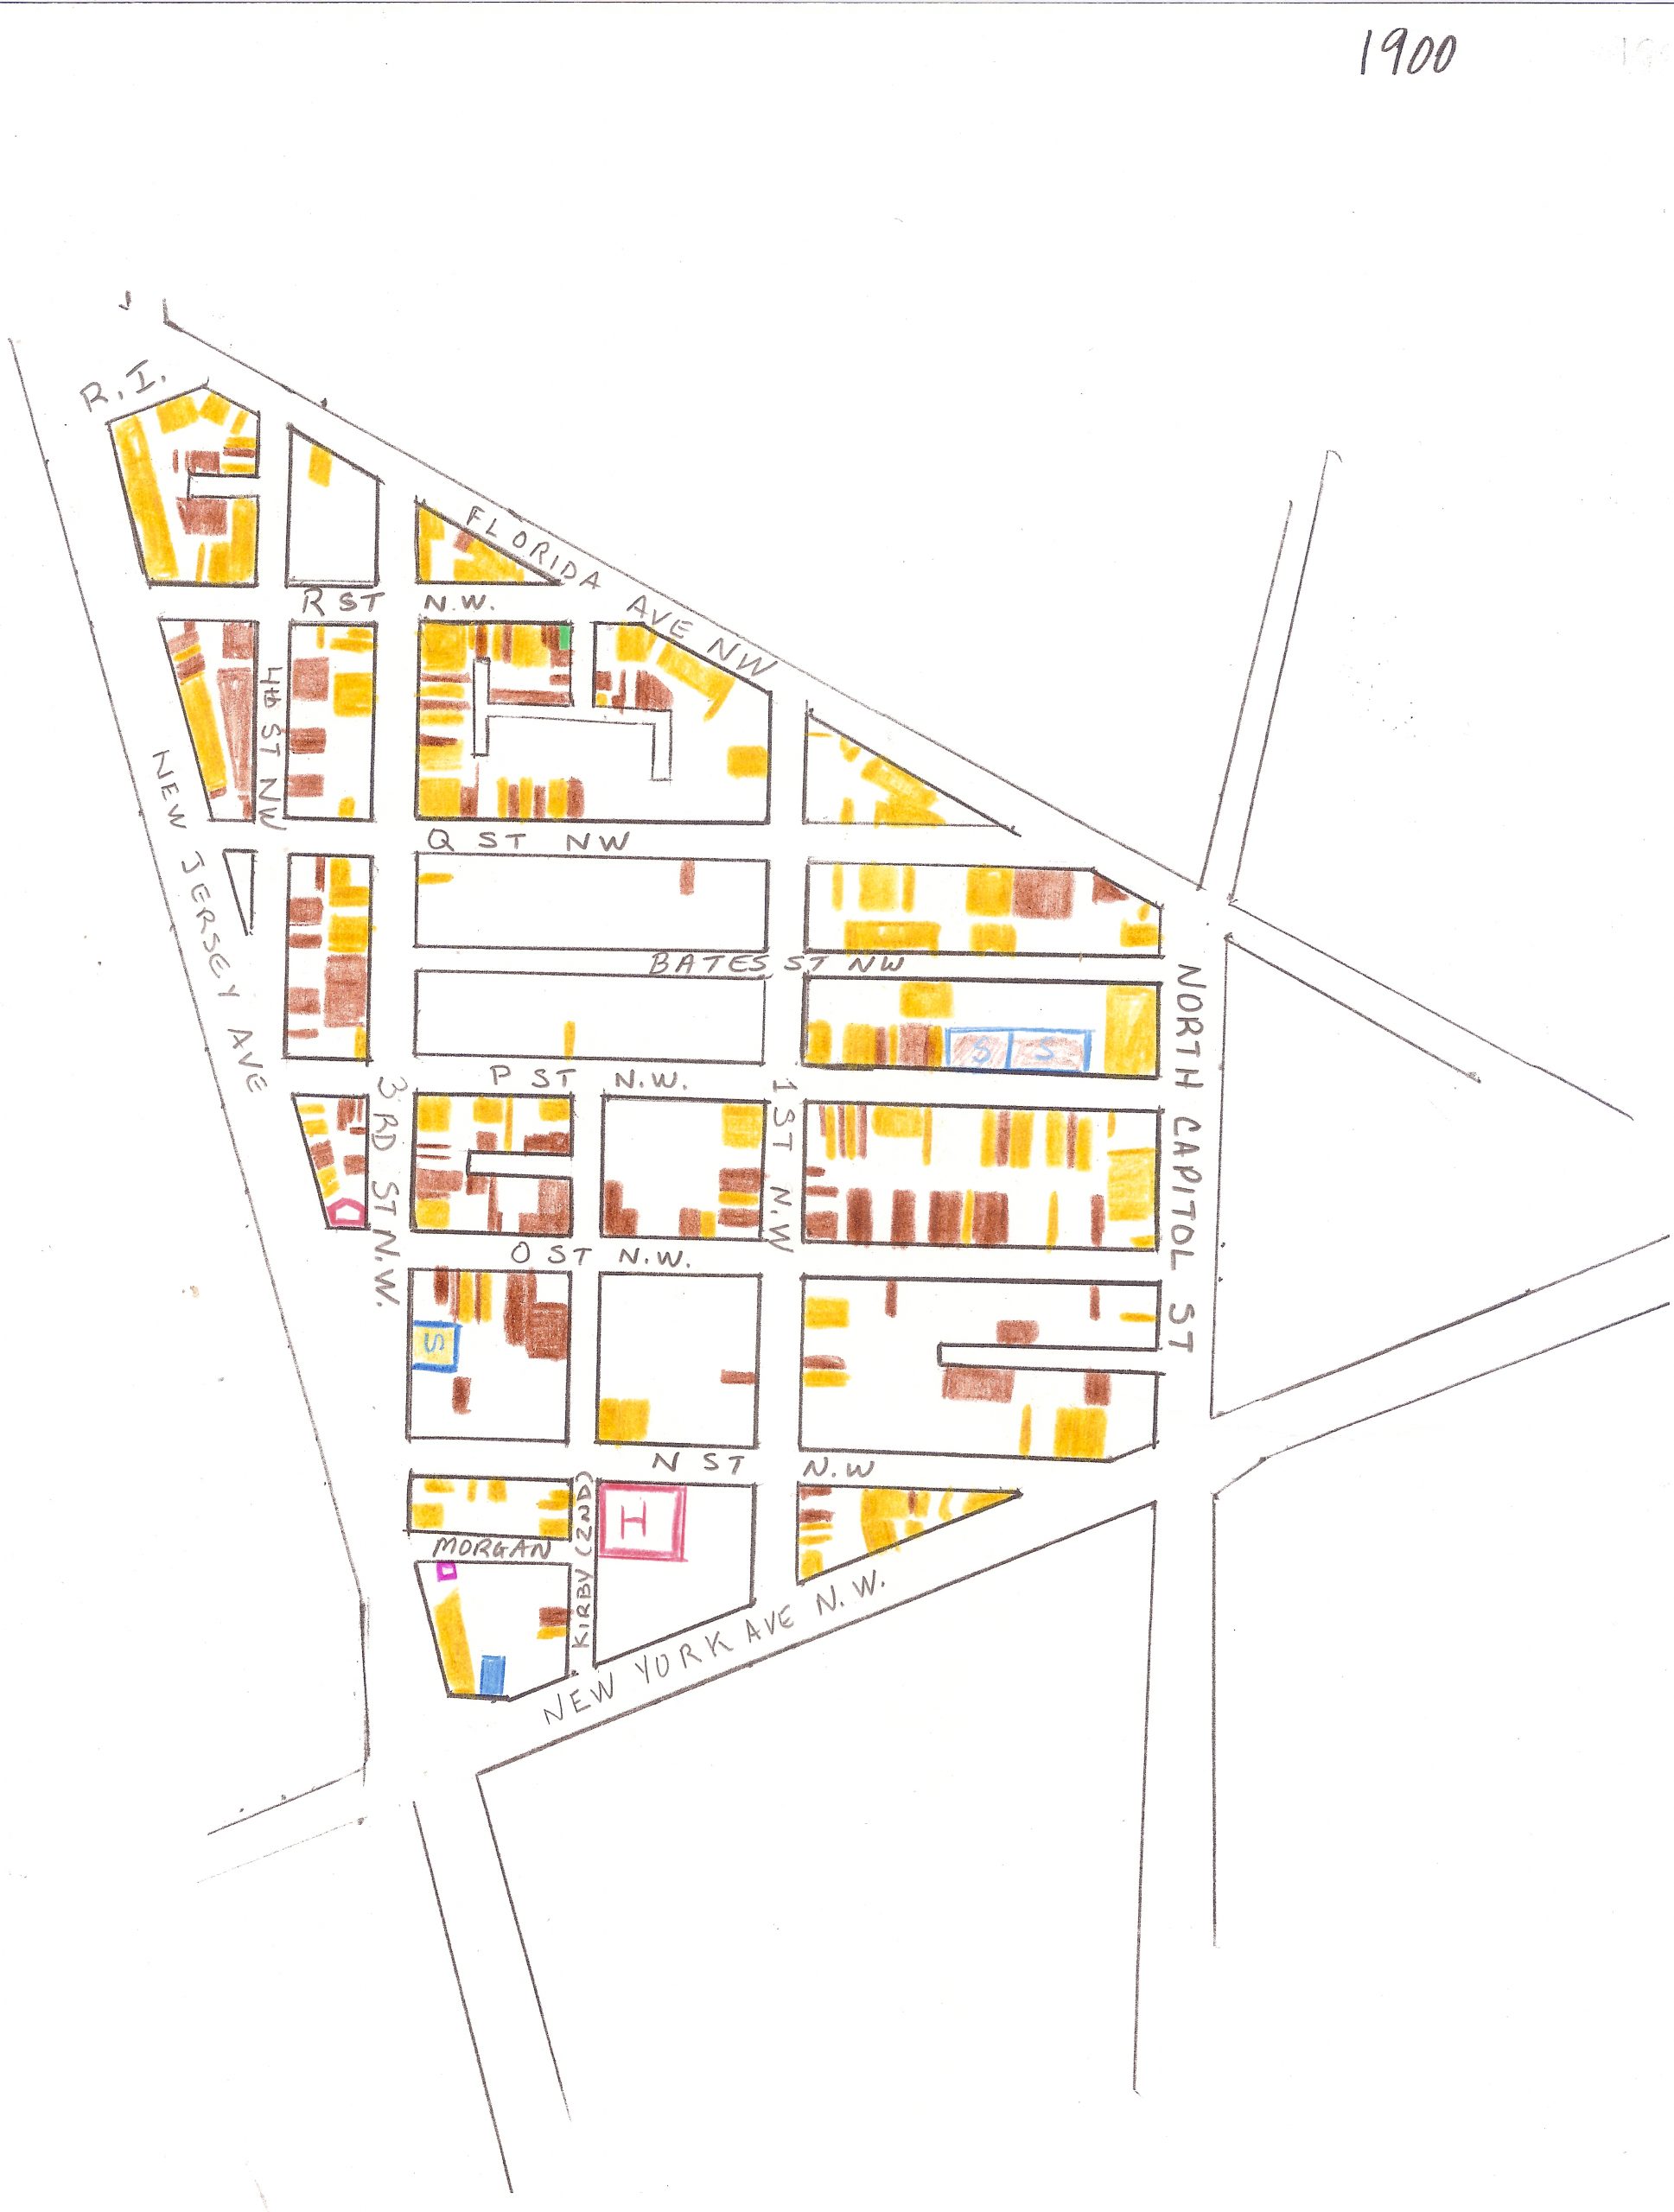
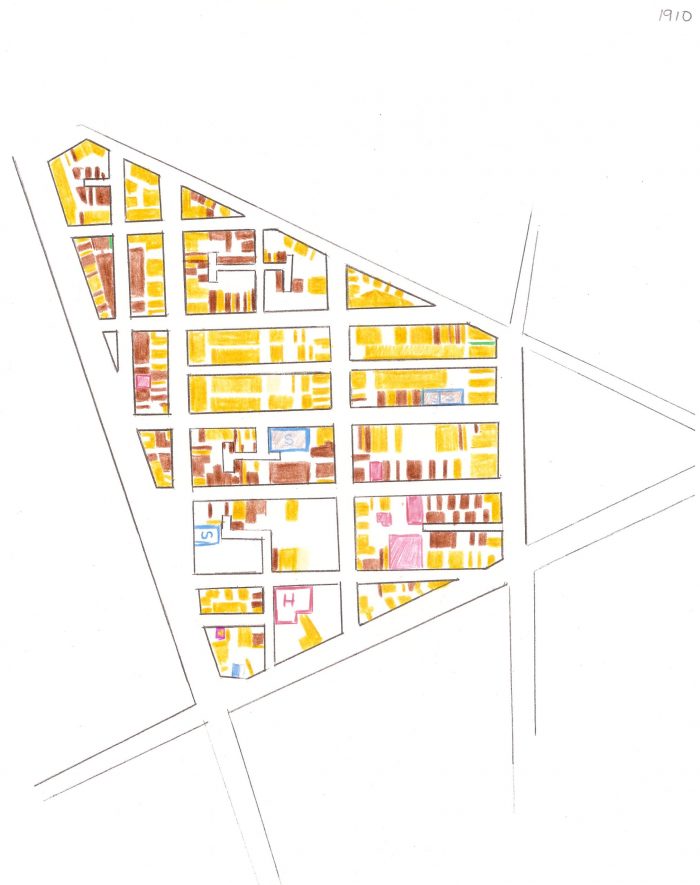
So hopefully you’ve read the previous blog post Change 1880-1940, which were a set of maps showing patterns of households in Truxton Circle by race. Since the 1950 census wasn’t out (it will come out in a few years), I could not create a map. Brian Bakke, one of the artists in the show, suggested I show (somehow) what happened after 1940. I came up with Beans!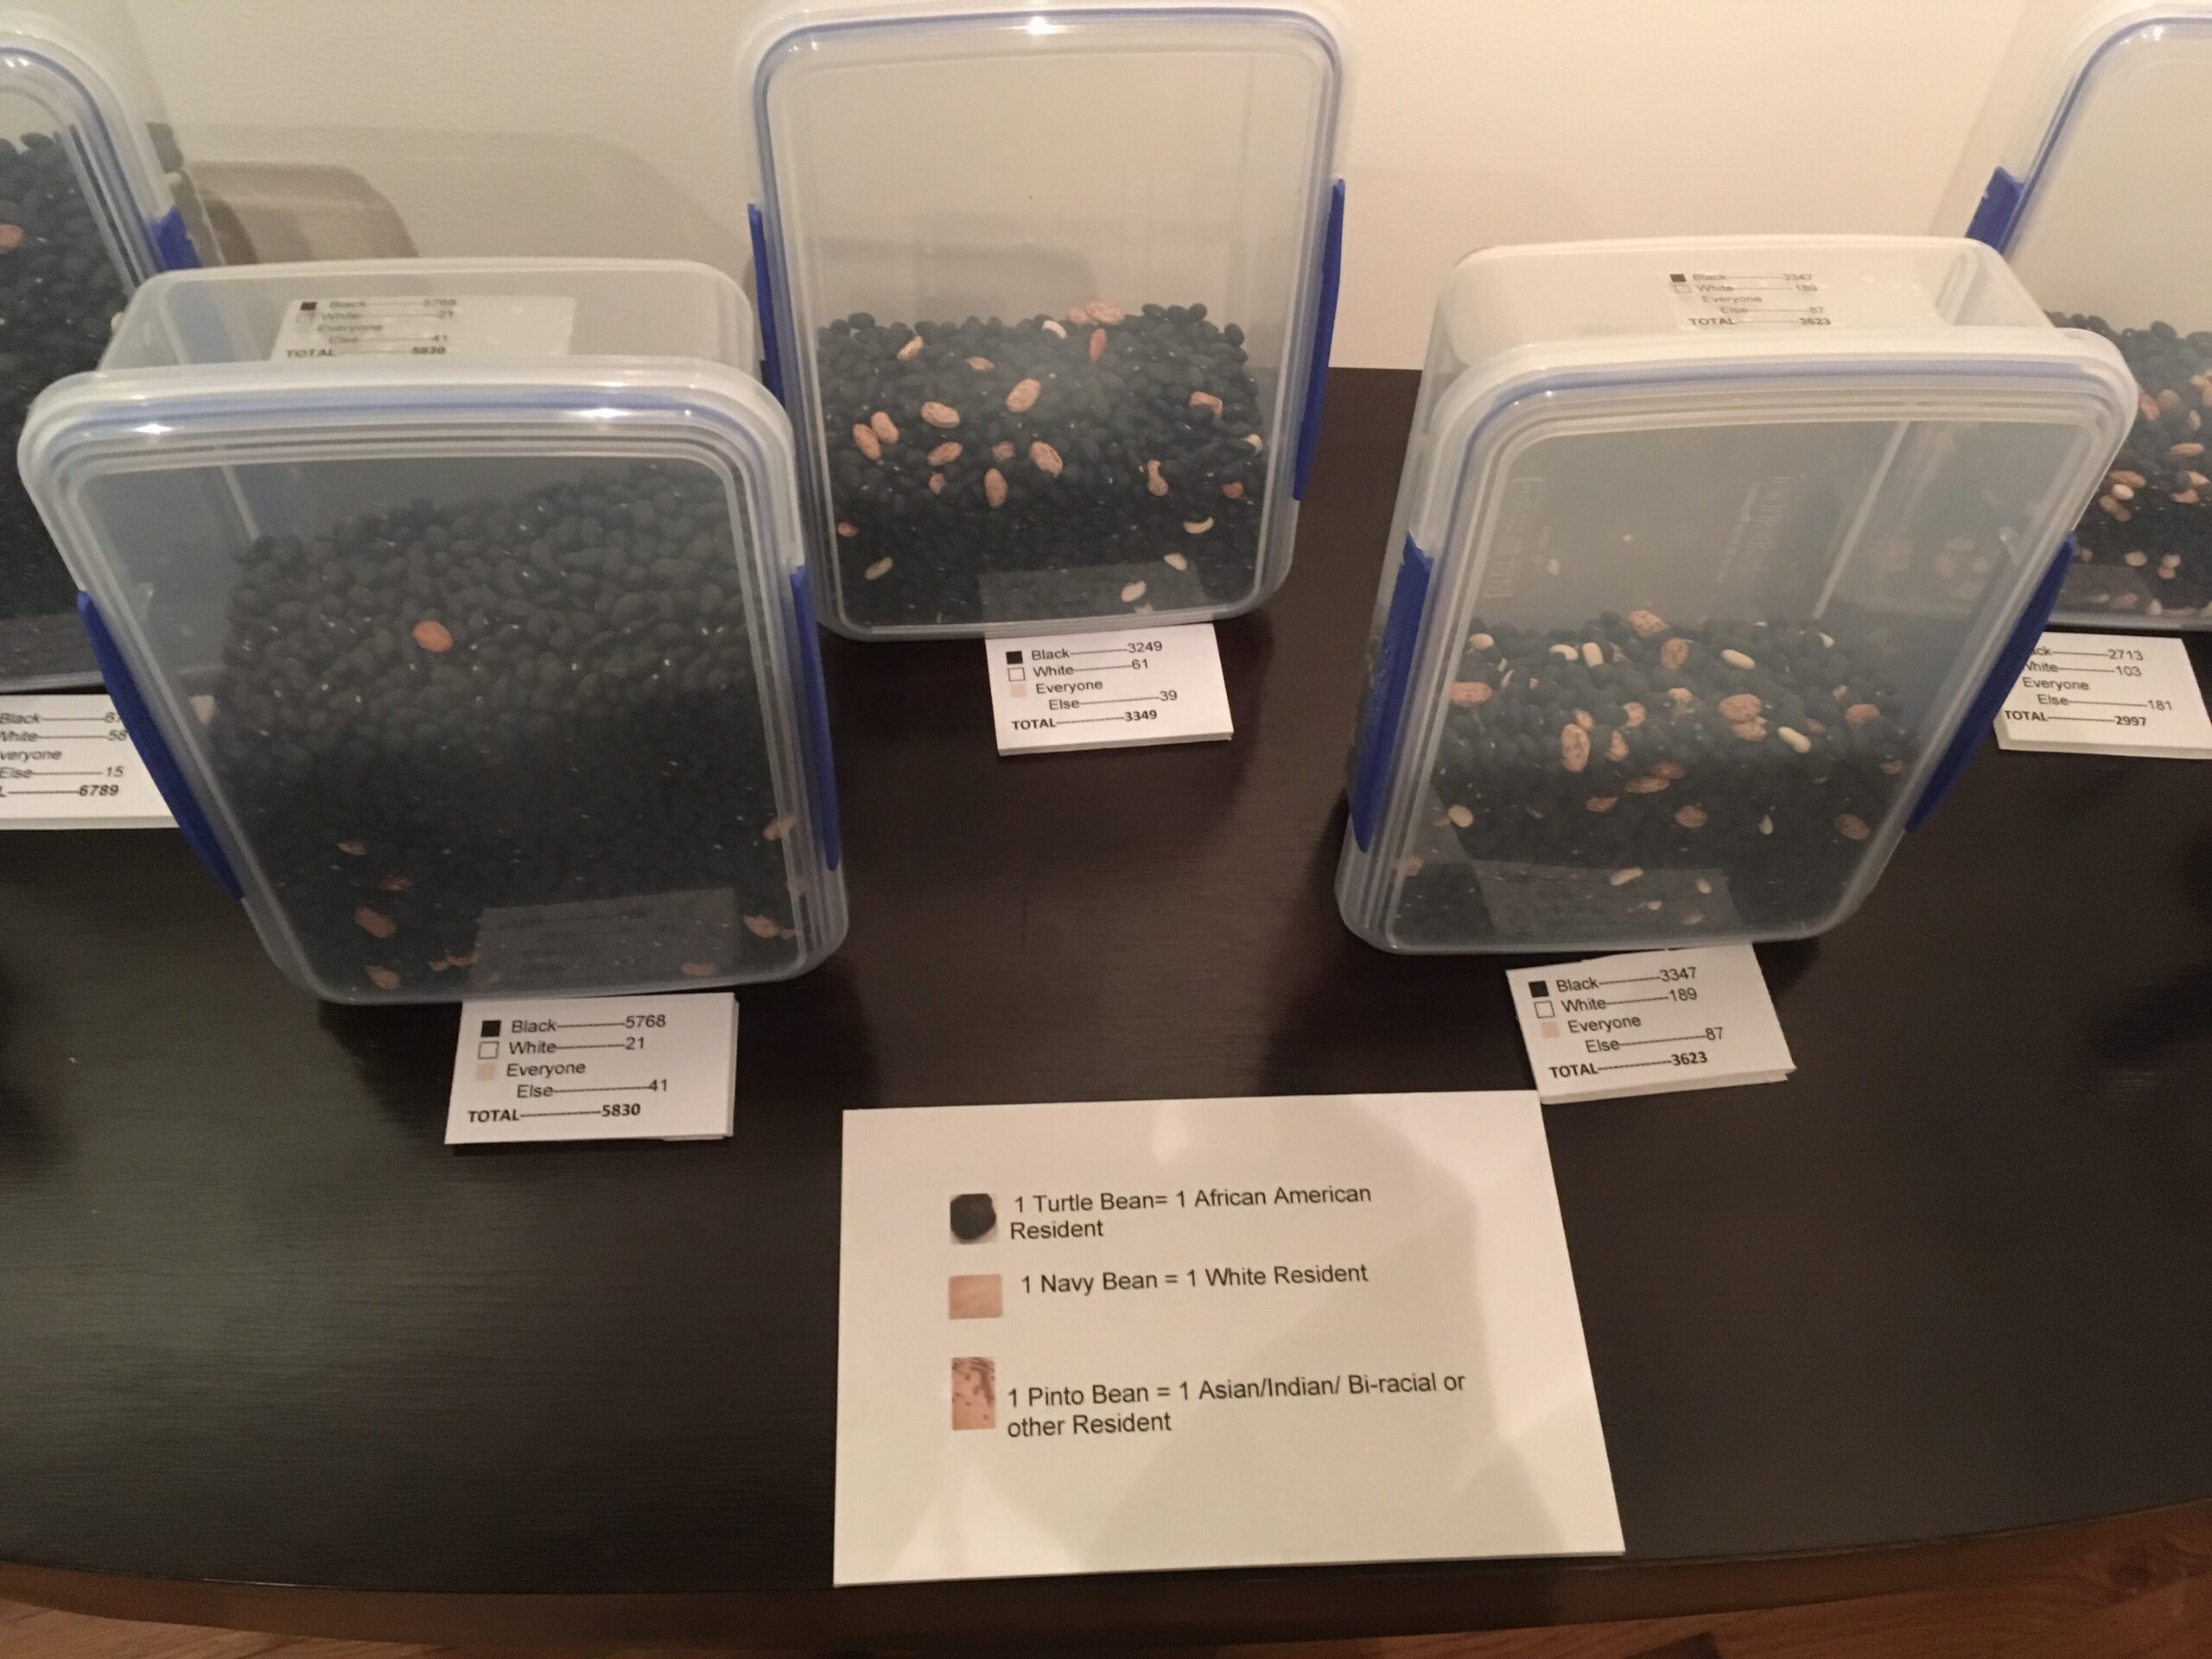
I could figure out easily how to show Black and White individuals. Black beans and white Navy beans. For everyone else, that was a struggle. I had to find a bean that was around the same size as the other beans AND visually different from the Navy beans. That wound up being the Pinto bean.
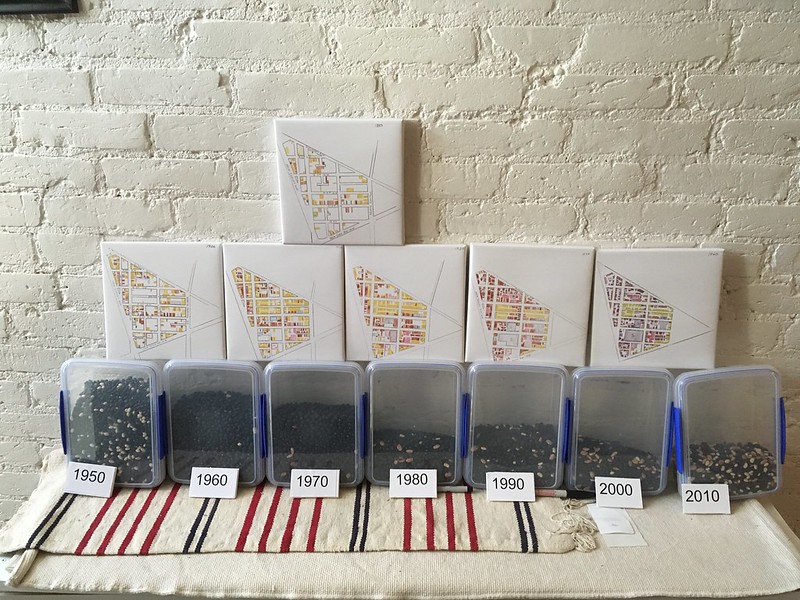 Looking at the various containers of Beans! the neighborhood is almost exclusively African American in 1960. And you may notice the number of residents (each bean represents one person) from 1950 has decreased a little bit by 1960. In 1970 the number goes down a bit more, but you might not notice. By 1980 the number of residents had significantly decreased in a noticeable way.
I remember being asked why was the population going down. There are various reasons, but the one I mentioned was the role of women changing. In 1950 African American kids were more likely to be raised in a two parent household than not, with mom at home. Here come the late 1960s and the Sexual Revolution and households got smaller. Women have less pressure to get married and have kids, or have kids at all.
There is also another change in the 1980s, a lot more other racial categories than Black or White show up. So more Pinto beans. By 2010 it is a whole bean soup mix melody.