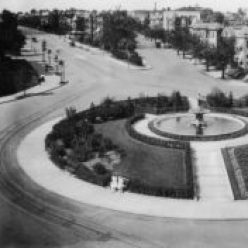
I got a warning months ago but didn’t really understand it. Citizen Atlas is gone. Sort of.
For years I have been using https://propertyquest.dc.gov/ to find information about houses in Truxton Circle and sometimes other parts of DC. I have used photos from Property Quest, which leaned on Citizen Atlas for photos for churches and other places.
But now that’s gone.
It makes sense in some ways. These photos are old enough to buy themselves a strong drink. So I hope they are with an archive or something. That is something I’ll have to look up later because this summer is personally busy for me.
Most places use Google Street View. Real estate websites use it along with the government. Those are the most up-to-date images of a property….. unless the owner or former owner has blocked it.
The photos aren’t completely gone. Not knowing when the photos will disappear, I copied all the ones used for the blog and the URLs (for now) work. Unfortunately, I THOUGHT, I had copied all the photos for Truxton Circle. But alas, no. I only did it for one block.
So I will eventually update the URLs on the blog to a page in the InShaw universe where I am hosting the images I have used. Yes, they are over 20 years old, but as far as I’m concerned they are government created and free to use.
I’m changing my Flickr account from paid to free and to do that I had to delete over 2000 images. Some of the images were transferred to this blog. The exercise did have me going down memory lane.
In 2017 two artists, Brian Bakke & Ira Tattleman, and myself had an exhibit in Truxton Circle called the Triangle Known as Truxton Circle. One of my exhibits showed the demographic changes to Truxton Circle from 1880-2010.
The drawings were of the filling out of the neighborhood. The top map was 1880. The following were 1900-1940.
On the maps, I took house by house information and colored white households with yellow; Black households with brown; government in blue with who they served filled in; and commercial properties in red.
The boxes of beans were to show the decline of the population. It was at its highest in 1940. The boxes had black beans for African Americans; Navy beans for Whites; and pinto for everyone else. The TC became a majority Afo-American neighborhood in 1930. You can see a lot of black beans in the 1950 box, along with speckles of navy beans. When WSIC sold off their rentals, those White renters left by the time the 1960 census rolled around.
As you can see the number of beans keeps decreasing year after year. And it isn’t until 1980 when the neighborhood starts seeing some racial diversity again.
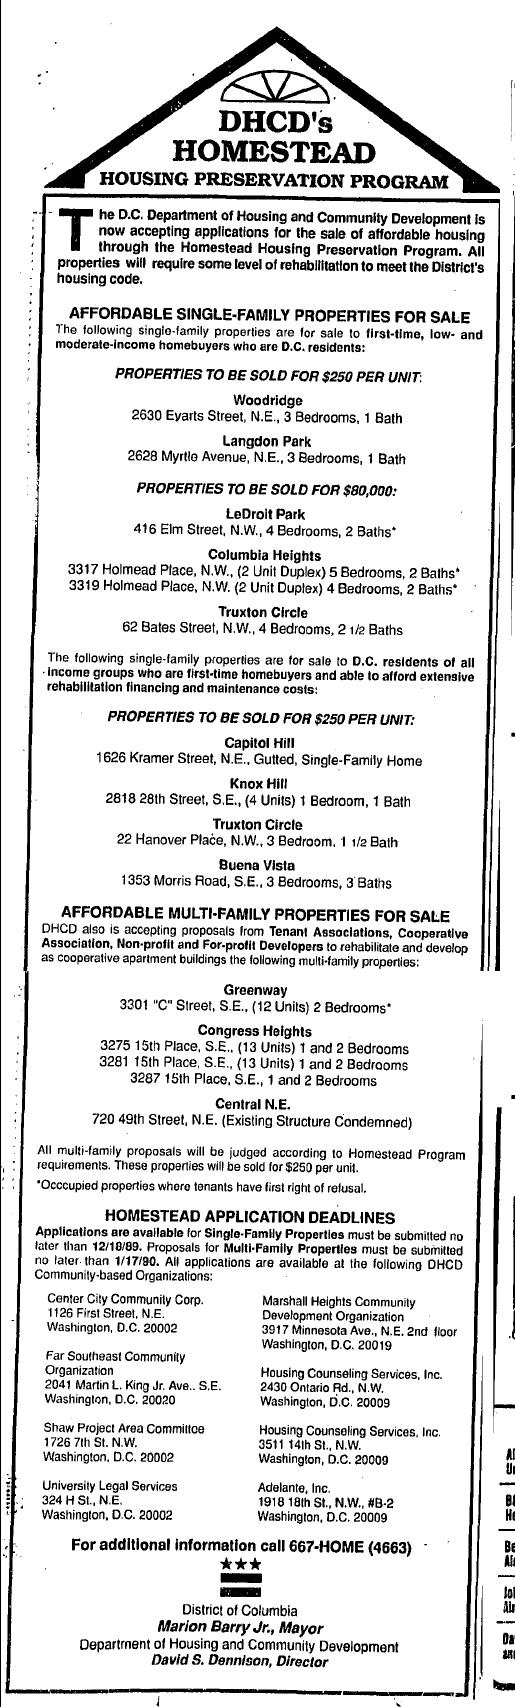
Okay firsts are tricky. They are very hard to prove. So with that said, I am going to write that in this advertisement from 1989, this was the first time the District of Columbia government called Truxton Circle, Truxton Circle.
For a mere $80,000 62 Bates St NW was being sold by DHCD. For a paltry $250.00, they offered 22 Hanover St NW.
Advert for houses for sale in 1989 for houses sold by the District Government from $250 to $80,000
Is it the very first time the DC government called Truxton Circle by the name we know it as now? Possibly. This is just the first bit of evidence I located to prove the point.
The Washington Sanitary Improvement Company (WSIC) was a late 19th century charitable capitalism experiment that ended in the 1950s. This blog started looking at the homes that were supposed to be sold to African American home buyers, after decades of mainly renting to white tenants.
Looking at WSIC properties they tend to have a pattern where the properties were sold to a three business partners, Nathaniel J. Taube, Nathan Levin and James B. Evans as the Colonial Investment Co. for $3 million dollars. Those partners sold to African American buyers. There was usually a foreclosure. Then the property wound up in the hands of George Basiliko and or the DC Redevelopment Land Agency (RLA). Then there were the odd lucky ones who managed to avoid that fate.
Let’s see 137 Bates’ property history:
January 1951 Evans, Levin and Taube sold the whole of 137 Bates St NW to two couples, George A. and his wife Gladys L. Watson, along with Clayton and wife Lizzie M. Williams.
January 1951 the Watsons and the Williams borrowed $5,050 from the Colonial Inv. Co’s preferred lenders, trustees Abraham H. Levin and Robert G. Weightman.
February 1963 the Watsons and the Williams were released from their mortgage.
August 1963, through an intermediaries Barbara and Robert Drake, the Watsons and the Williams placed the property solely in the Williams’ name.
March 1964 the Williams borrowed $5,000 from Republic Savings & Loan, later the Home Federal Savings & Loan Association.
November 1981 the Williams were released from their 1964 mortgage.
May 2018 the estate of Lizzie Mae Williams, being that she died July 13, 1997 and Clayton died July 25, 1971, sold by the Estate of Diane Alexander, which was represented by Alisia Alexander sold 137 Bates to Leben Holdings LLC for $805,500.
For information about the Watsons and the Williams, see the earlier post. But this transaction seemed to work for everyone. There were no foreclosures and the property stayed in the hands of one of the families (I could not find a connection between the Watsons & Williams).
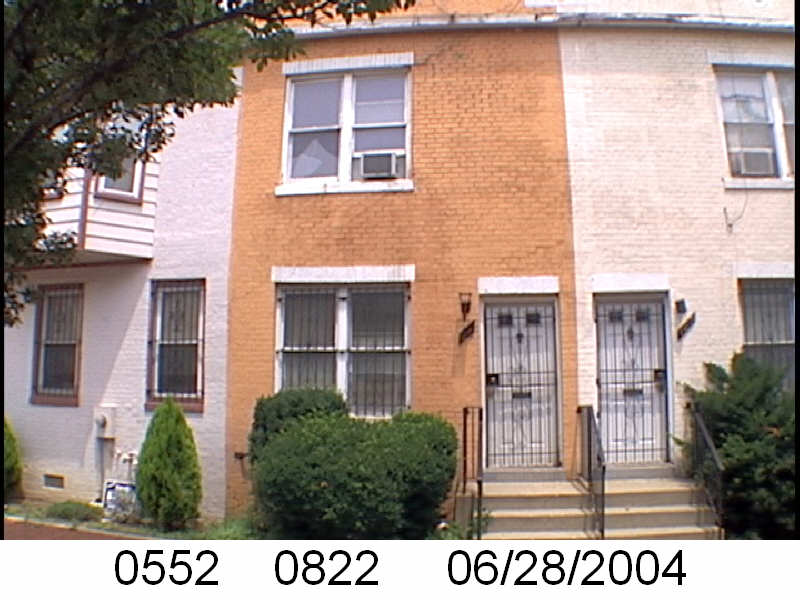
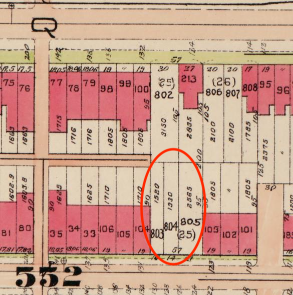
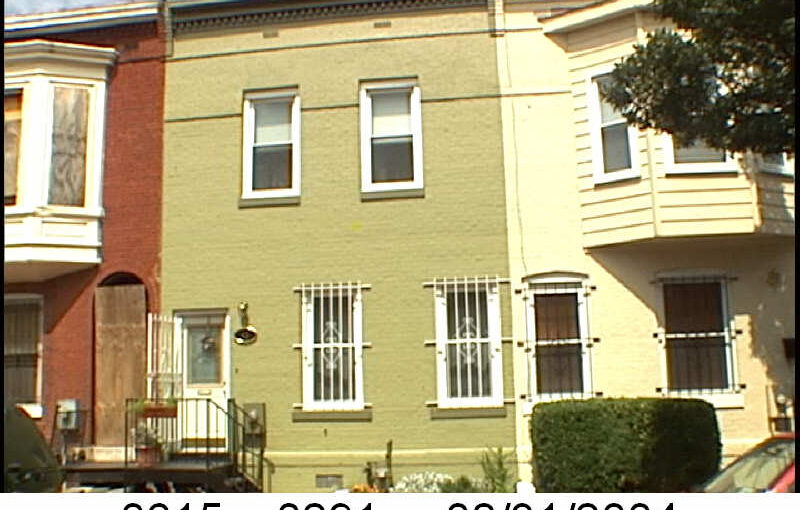
So I thought this was a WSIC house. It wasn’t built as one. However, it was sold as one.From the picture above of 127 Bates from 2004, the lot number is 0821. The land records for that lot number only goes back to 2013. So to the 1919 map
1919 Baist Map of section of Square 552
127 Bates Street NW appears to have been Lot 804. The record for that lot end in 1929. That’s the year the house was built, well after the majority of WSIC TC houses were erected.
Working on the house history of 129 Bates Street NW, it was sold as a fourplex. However, the current structure doesn’t look like a former 4 unit property. But if you combine it with 127, it does. So lets go with that. For that history check out the link above for 129 Bates.
The summary, if assuming 127-129 Bates was one, there were 3 foreclosures. It was sold to DC RLA who then sold it to the Bates Street Associates.
This is a redo of a previous post to add a little bit of more info.
The Washington Sanitary Improvement Company (WSIC) was a late 19th century charitable capitalism experiment that ended in the 1950s. This blog started looking at the homes that were supposed to be sold to African American home buyers, after decades of mainly renting to white tenants.
Looking at WSIC properties they tend to have a pattern where the properties were sold to a three business partners, Nathaniel J. Taube, Nathan Levin and James B. Evans as the Colonial Investment Co. for $3 million dollars. Those partners sold to African American buyers. There was usually a foreclosure. In 1956 Nathan Levin died and Colonial Investment Company vice president Harry A. Badt took his place in the foreclosure paperwork. Then the property wound up in the hands of George Basiliko and or the DC Redevelopment Land Agency (RLA). Then there were the odd lucky ones who managed to avoid that fate.
1919 Baist Map. Portion of Sq. 552
First, the lot number 822 doesn’t work. Looking at maps 129 Bates fits on lots 819 & 820, formerly of lot 25. So this examination will look at sales for lots 819/820 combined.
The last time I tried this, titles were too messy for me to do a decent tracking for this address and I gave up. I’ll make another stab at it.
Let’s see what happens with 129 Bates St NW:
March 1951 Evans, Levin and Taube sold 1/4 of the unit to Harold J. and Margaret A. Price.
March 1951 the Prices borrowed $3,700 from Colonial Investment Co. favorite trustees Abraham H. Levin and Robert G. Weightman.
May 1951 Evans, Levin and Taube sold 1/4 of 129 Bates to Elsie M. and James W. Horton.
May 1951 the Hortons borrowed $3,650 from trustees Levin and Taube.
May 1951 Evans, Levin and Taube sold 1/4 of the property to Doris E. and Thomas H. Brown Jr.
May 1951 the Browns borrowed $3,650 from Levin and Weightman.
June 1951 Evans, Levin and Taube sold the remaining 1/4 to Marian and Thomas P. Gale.
June 1951 the Gales borrowed $3,700 from Levin and Weightman.
July 1951 the Prices sold 1/4 of their property to Charles M. and Mabel C. Bowser.
June 1953 the Browns lost their quarter to foreclosure, and Evans, Levin and Taube repossessed the property via an auction.
August 1954, in a large property package Evans, Levin and Taube transferred several foreclosed properties to themselves via an intermediary Lillian M. McGowan. I don’t know why.
December 1954 the Hortons lost their quarter to foreclosure, and Evans, Levin and Taube repossessed the property via an auction.
December 1957, the Gales lost their quarter to foreclosure, and Evans, Badt and Taube repossessed the property via an auction.
December 1957, as part of a larger property package ( doc # 1958019347) Harry and wife Jennie Badt transferred their interests in this and other properties to the survivors of Nathan Levin.
October 1963, the Prices, and by extension the Bowsers, were released from their mortgage.
December 1972 James B. and wife Carmen Evans, in a very large property package (doc#1972027675 ) sold their interest to R & R Investments Inc.
November 1972, James A. Mitchell’s* survivors, Sidney H. and wife Olivia Matthews, along with Harry C. and Gloria Matthews, Nathaniel Taube, and Nathan Levin’s survivors sold their interest in the property to the District of Columbia Redevelopment Land Agency.
January 1973, R & R Investments sold their interest to the DC Redevelopment Land Agency.
May 1974 the Board for the Condemnation of Insanitary Buildings decided that 129 Bates Street NW was condemned (doc# 7400013192) and informed the owner, DC RLA.
June 1975 129 Bates was considered sanitary.
About 1978 DC RLA transferred/ sold this and other properties to the Bates Street Associates, Inc.
129 Bates does not strike me as a 4 unit property. I’m not sure what happened with the Bowsers. Their quarter was not foreclosed, like the other 3/4th of 129 Bates. Eventually, 129 Bates was owned by the DC RLA and then Bates Street Associates. The slum landlord who usually shows up, did not.
Looking for the deed history of 127 Bates St NW, it is pretty much the same as 129, except it also has lot 782, which only appears once.
This is a redo of a previous post to add a little bit of more info.
The Washington Sanitary Improvement Company (WSIC) was a late 19th century charitable capitalism experiment that ended in the 1950s. This blog started looking at the homes that were supposed to be sold to African American home buyers, after decades of mainly renting to white tenants.
Looking at WSIC properties they tend to have a pattern where the properties were sold to a three business partners, Nathaniel J. Taube, Nathan Levin and James B. Evans as the Colonial Investment Co. for $3 million dollars. Those partners sold to African American buyers. There was usually a foreclosure. In 1956 Nathan Levin died and Colonial Inv. Co. vice president Harry A. Badt took his place in the foreclosure paperwork. Then the property wound up in the hands of George Basiliko and or the DC Redevelopment Land Agency (RLA). Then there were the odd lucky ones who managed to avoid that fate.
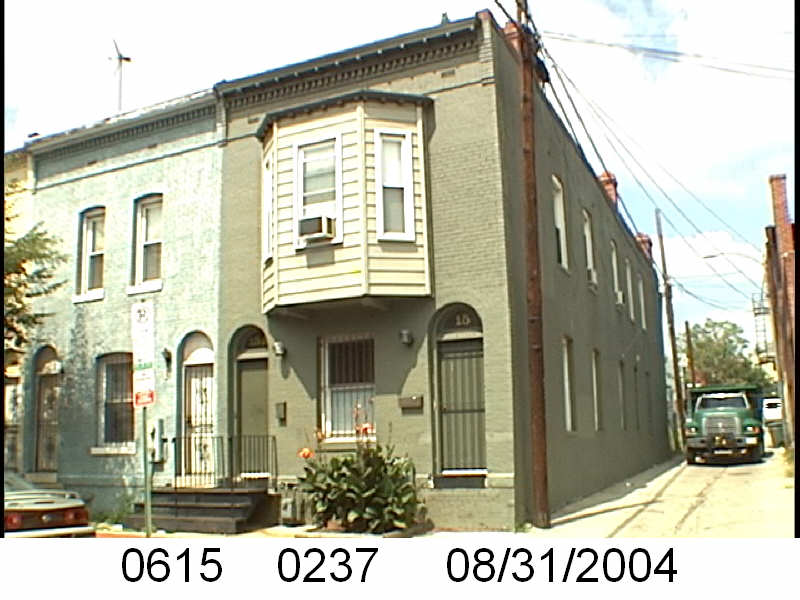
Let’s see what happens with 15 Bates St NW:
January 1951 Evans, Levin and Taube sold the whole of 15 Bates St NW to Jessie I. Johnson, married and Maude Y. Ryles, widow.
Jan 1951 Johnson and Ryles borrowed $6,050 from Colonial Investment Co. favorite trustees Abraham H. Levin and Robert G. Weightman.
July 1963 Ryles and Johnson borrowed $6,600 from the Perpetual Building Association with trustees Junior F. Crowell and Samuel Scrivener Jr.
October 1963 Ryles and Johnson were released from their Jan 1951 mortgage.
October 1963 Ryles and Johnson benefited from the release of a loan taken out by Evans, Levin and Taube in November 1950.
December 1976 Ryles and Johnson sold the property Cleveland R. and Harriette Chambliss.
May 1990 Harriette, who was Cleveland’s widow and her next husband, George W. Crockett Jr sold the house to Lincoln Jenkins.
September 1990 Ryles and Johnson were released from their 1963 mortgage…. long after they sold the house.
This appears to work as promised. No foreclosures, no slum lords, no redevelopment agencies.
I found the Maude Ryles lived at 15 Bates Street NW according to the 1954 city directory. The rest of her history, I am not 100% about, but here’s my best shot. She may have been Maude Ann Yancey as a 1961 obit for Mariah H. Yancey mentions Maude Ann Ryles as the stepmother to her and several other girls and the foster mother of George Jordon of New York. So that’s where I guess the Y is for. In the 1950 census she was living at 62 Q St NW, Apt. 2, with a roommate and working as some sort of operator for Veteran’s (Affairs?). She died June 1980 and according to the Social Security Death Index she was born May 13, 1902, however her grave differs saying she was born in 1903.
According to the obit on the Find a Grave site, Jessie Y. Johnson was her sister. So I looked for her in the 1954 city directory and found her at 15 Bates Street NW. It appears she was an examiner for the Bureau of Engraving and Printing. In the 1950 census, she too was living at 62 Q St NW, but Apt 1. She was living with her husband Chester Arthur Johnson and 20 year old daughter Iris.
The Washington Sanitary Improvement Company (WSIC) was a late 19th century charitable capitalism experiment that ended in the 1950s. This blog started looking at the homes that were supposed to be sold to African American home buyers, after decades of mainly renting to white tenants.
Looking at WSIC properties they tend to have a pattern where the properties were sold to a three business partners, Nathaniel J. Taube, Nathan Levin and James B. Evans as the Colonial Investment Co. for $3 million dollars. Those partners sold to African American buyers. There was usually a foreclosure. In 1956 Nathan Levin died and Colonial Inv. Co. vice president Harry A. Badt took his place in the foreclosure paperwork. Then the property wound up in the hands of George Basiliko and or the DC Redevelopment Land Agency (RLA). Then there were the odd lucky ones who managed to avoid that fate.
The 45 Bates St NW post had some confusion and hopefully in this update I can do a better job.
Let’s see what happen with 43 Bates St NW:
December 1950 (recorded Jan 26, 1951) Evans, Levin and Taube sold one-half of 43 Bates St NW to Elizabeth and Neal Nelson.
December 1950 (recorded Jan 18, 1951)the Nelsons borrowed $2,525 from Colonial Investment Co. favorite trustees Abraham H. Levin and Robert G. Weightman.
January 1951 Evans, Levin, and Taube sold the other half of 43 Bates St NW to Mrs. Irene Brown, James E. Rogers and his wife Perlina Rodgers.
January 1951 Brown and the Rodgers borrowed $2,525 from trustees Abraham H. Levin and Robert G. Weightman.
September 1952 Brown and the Rodgers lost their half to foreclosure and through an auction it returned to Evans, Levin and Taube.
Sept 1952 Evans, Levin and Taube sold the foreclosed half to Bernice and Hickman Leathers.
September 1952 the Leathers borrowed $3,173.94 from trustees Levin and Weightman.
March 1954 the Leathers lost their half to foreclosure, and like the last time, Evans, Levin and Taube repossessed it via an auction.
April 1954 Evans, Levin and Taube resold the foreclosed half to Leotta Francis, Isabell Forde and Rosalie Forde.
April 1954 Francis and the Fordes borrowed $3,186.77 from trustees Levin and Weightman.
September 1956 (recorded 3/14/1958) the Nelsons lost their half to foreclosure and ownership went to to Colonial Investment Co partners Harry A. Badt, Evans and Taube, though an auction.
September 1956 (recorded 8/27/1958, Doc 1958025810) Harry A. Badt and wife Jennie, transferred their interest in 43 Bates and other properties to the survivors of Nathan Levin.
March 1957 Francis and the Fordes sold their half back to Badt, Evans and Taube.
March 1959 Francis and the Fordes were released from their mortgage.
March 1959 (doc# 1959019387) Badt, Evans, Taube, Nathan Levin’s survivors and their spouses sold the whole of 43 Bates St NW and other properties on the block to Sophia and George Basiliko.
Between 1971-1972 Basiliko was released from several mortgages and the next document has the DC Redevelopment Land Agency (RLA) as the owner, so we are left to assume around 1970 Basiliko sold the property to RLA.
Around 1978 the DC RLA sold/transferred this and other properties to the Bates Street Associates. A contract (doc #7800024140) DC RLA and Bates Street Associates, Inc suggests the property was transferred around this time.
This is the second look at 144-16-95 [Frank Ray, Melvin Clements; Loran Lovan Taylor, Roland L. Gay – Victims] for information about an incident that happened around the 600 block of Rhode Island Avenue in 1952.
We’ll skip over a few witnesses. If you want to read their testimony go to the link above for DOJ file 144-16-95.
I’m picking Buster Key of 1715 1/2 7th St NW because he seems to be one of the less than reliable witnesses.
INTERVIEW WITH BUSTER KEY
BUSTER KEY, 1715 1/2 7th Street, N. W., was interviewed on October 29, 1952 in Marion Court and advised that he has know the victim for several years and had seen him on numerous occasions in Marion Court. He stated that on July 13, 1952, he was visiting in the Court and at approximately 9:00 AM, he had noticed ZEKE in the Court. He pointed out that at the time ZEKE was not drunk and had come to a point where he, BUSTER, was standing and had given him a drink of wine from a quart bottle. BUSTER stated that he later left the alley and returned sometime in the late afternoon, at which time he noticed that ZEKE was sitting in a doorway on the west side of the alley at approximately 1721 Marion Court. He explained that when the police officers came into the alley, he was standing at a position opposite to ZEKE across the alley and that he had seen the police officers take ZEKE by his arms and walk him down the alley in the direction of “R” Street, N.W. KEY stated that at no time while victim and police officers were in the alley did he see any fighting or scuffling and that ZEKE was not hit by either of the officers during the period that he was in their custody, in Marion Court. Continue reading It happened on the 600 block of Rhode Island in 1952, part 8 of many
 But now that’s gone.
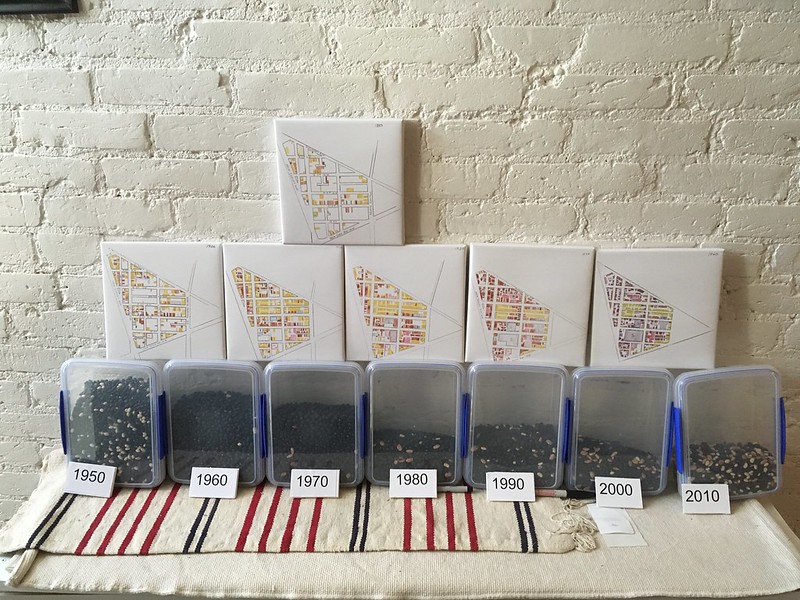
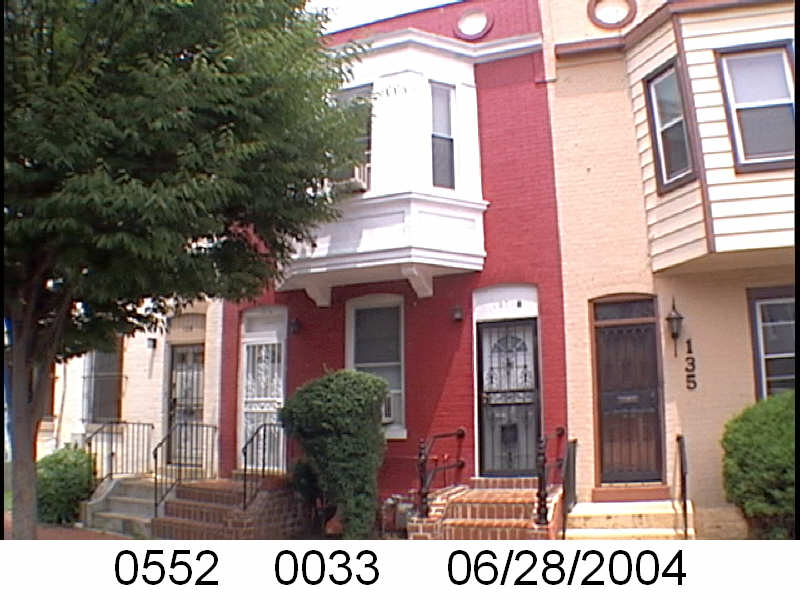
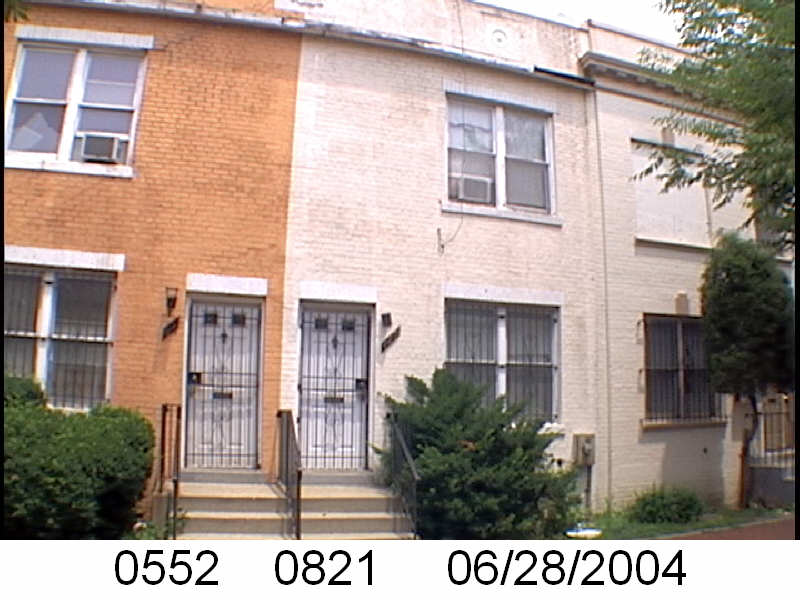 From the picture above of 127 Bates from 2004, the lot number is 0821. The land records for that lot number only goes back to 2013. So to the 1919 map