So I just got my email from Tock so I can debate if I want to pick up food from the Dabney or pick things out of boxes and try to cook something. Anyway, I spotted an option from the soon- someday to open Oyster Oyster across the “street” from Giant. No oysters though. It’s a vegetarian menu.
Month: July 2020
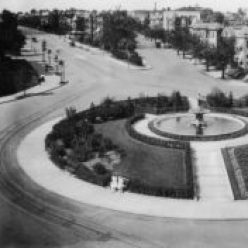
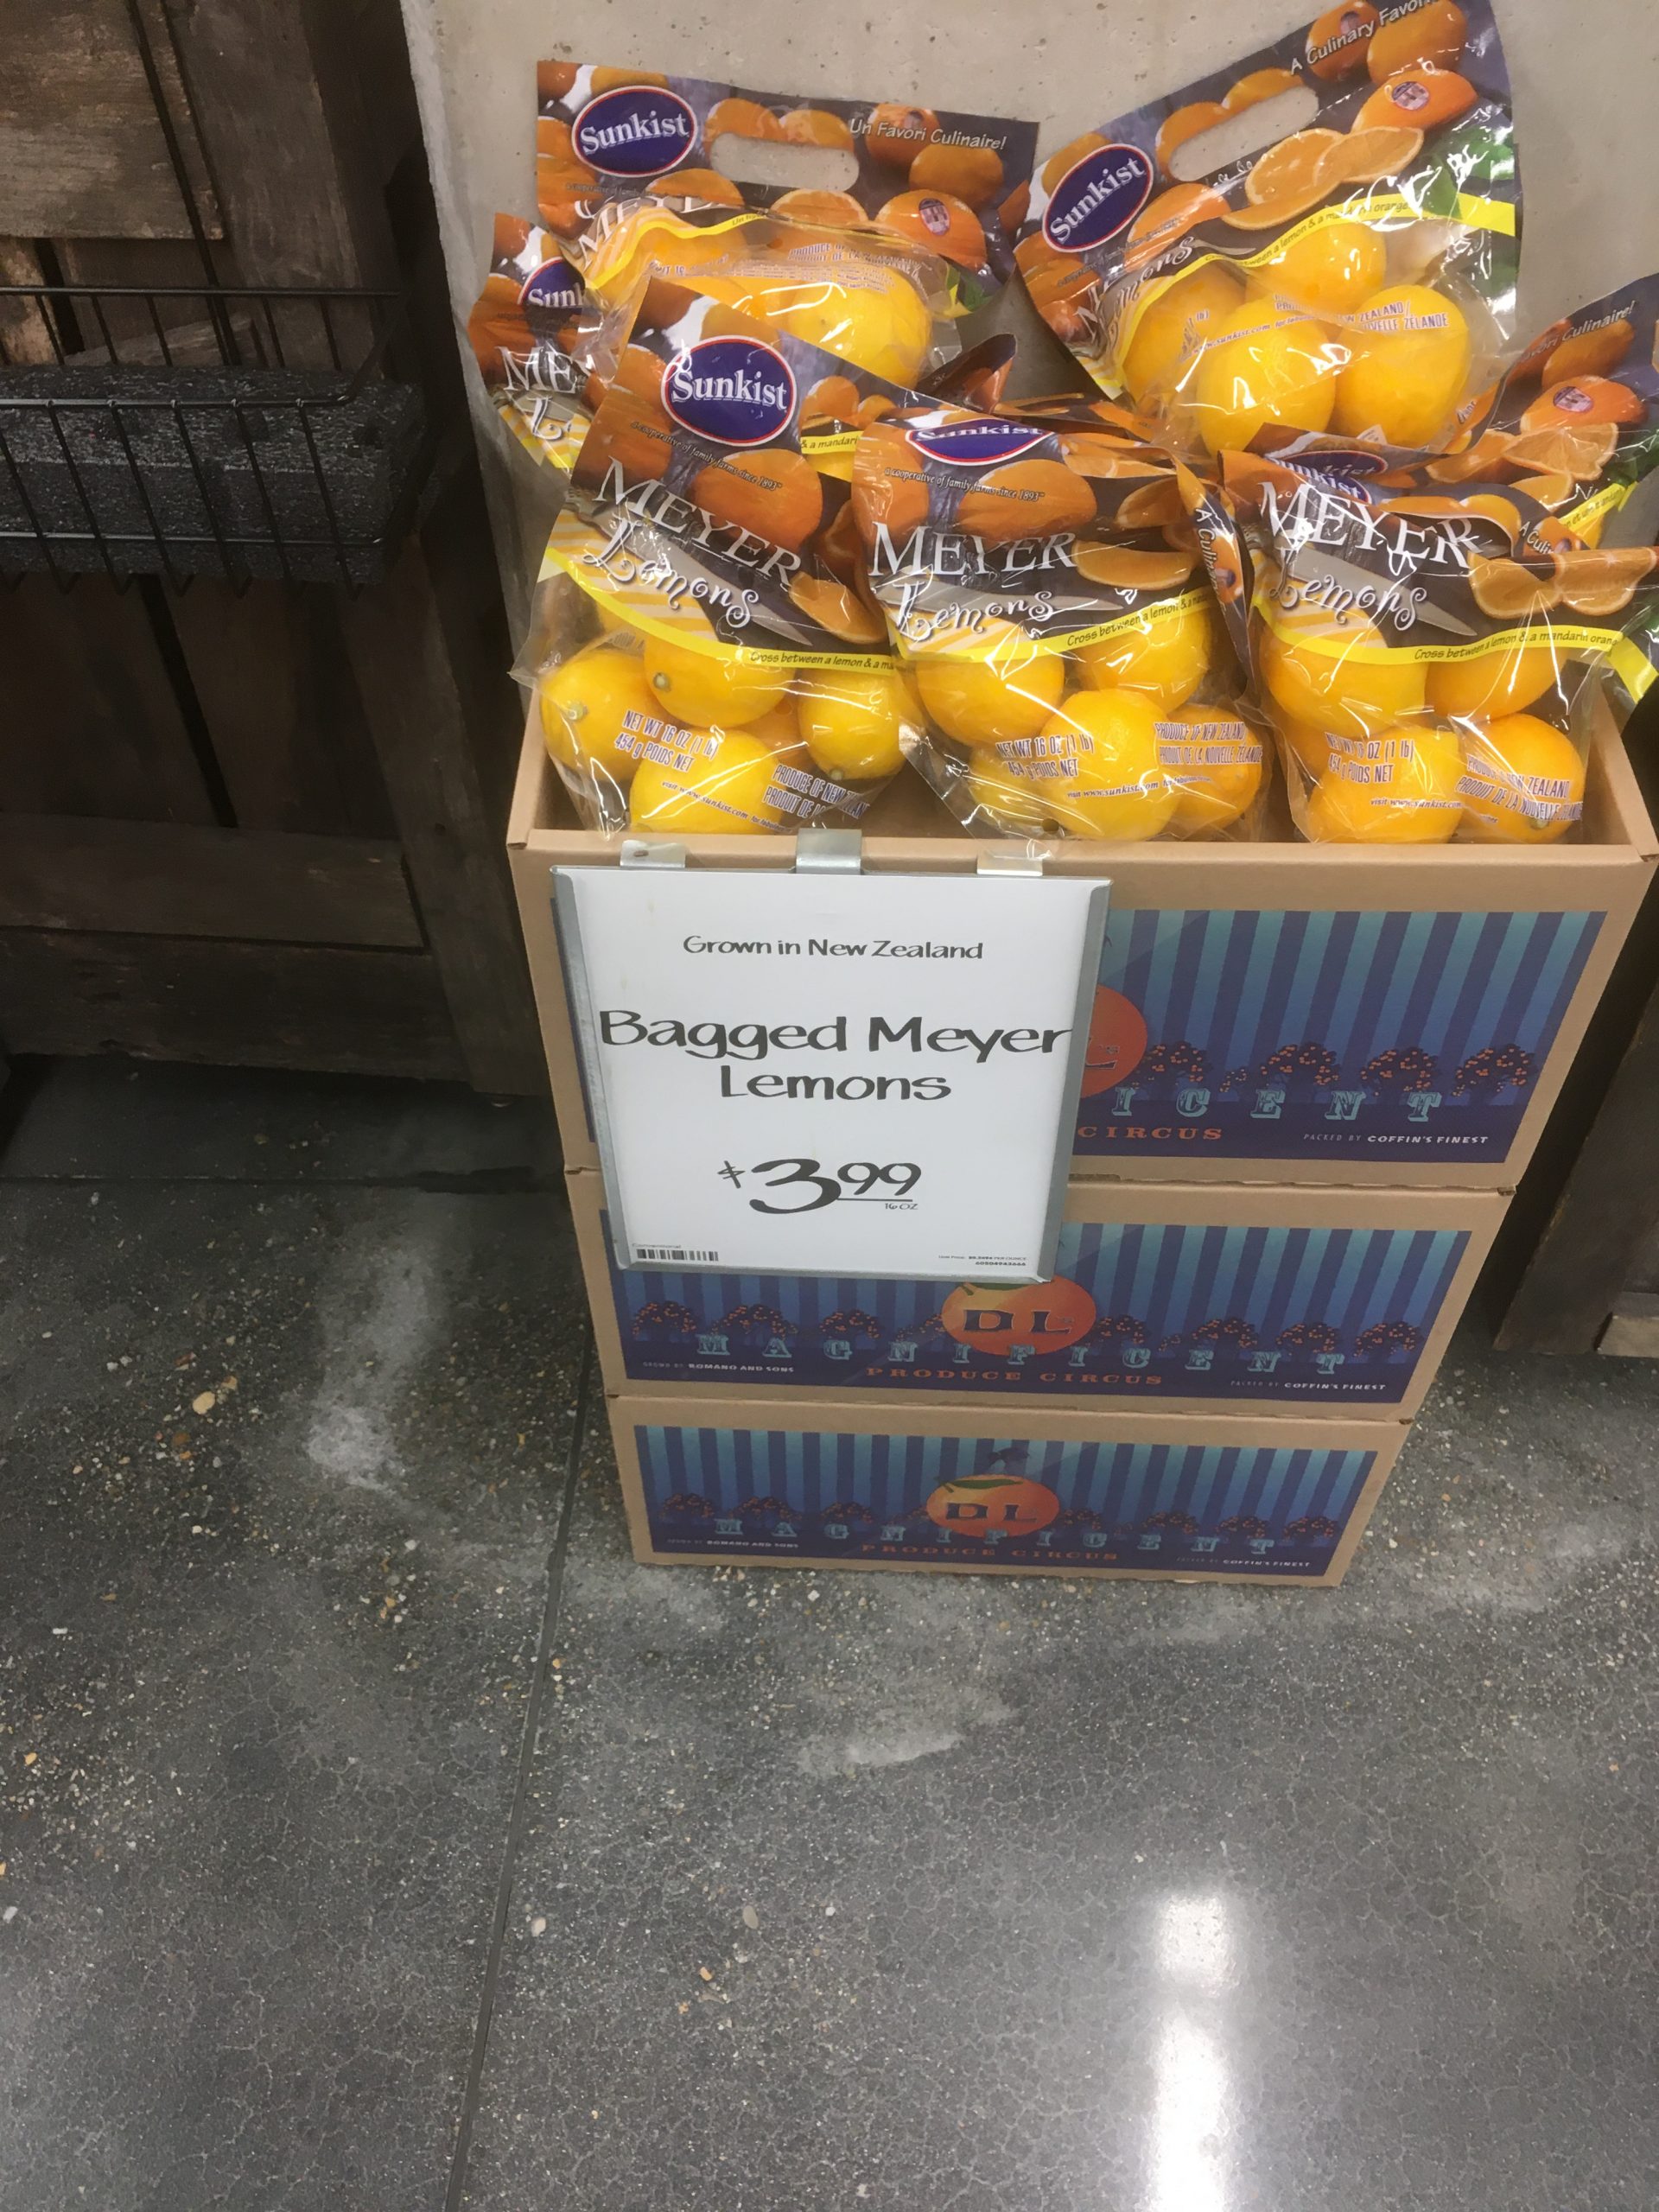
Have you been to the new Whole Foods?
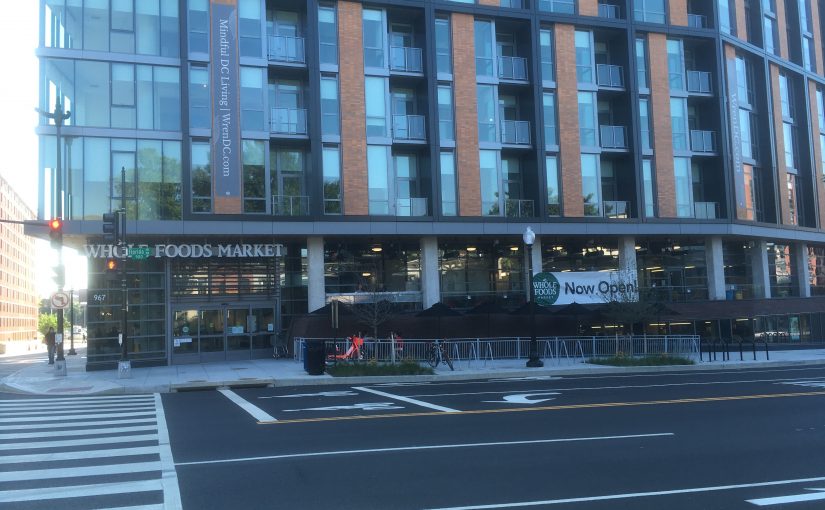
There is a new Whole Foods and it is in better* walking distance than the one at 14th and P NW. It’s over near Florida and Sherman (between 9th and 10th NW).
 I went early in the morning. No line. No crowds. Actually it seemed that the number of staff equaled the number of patrons in the store.
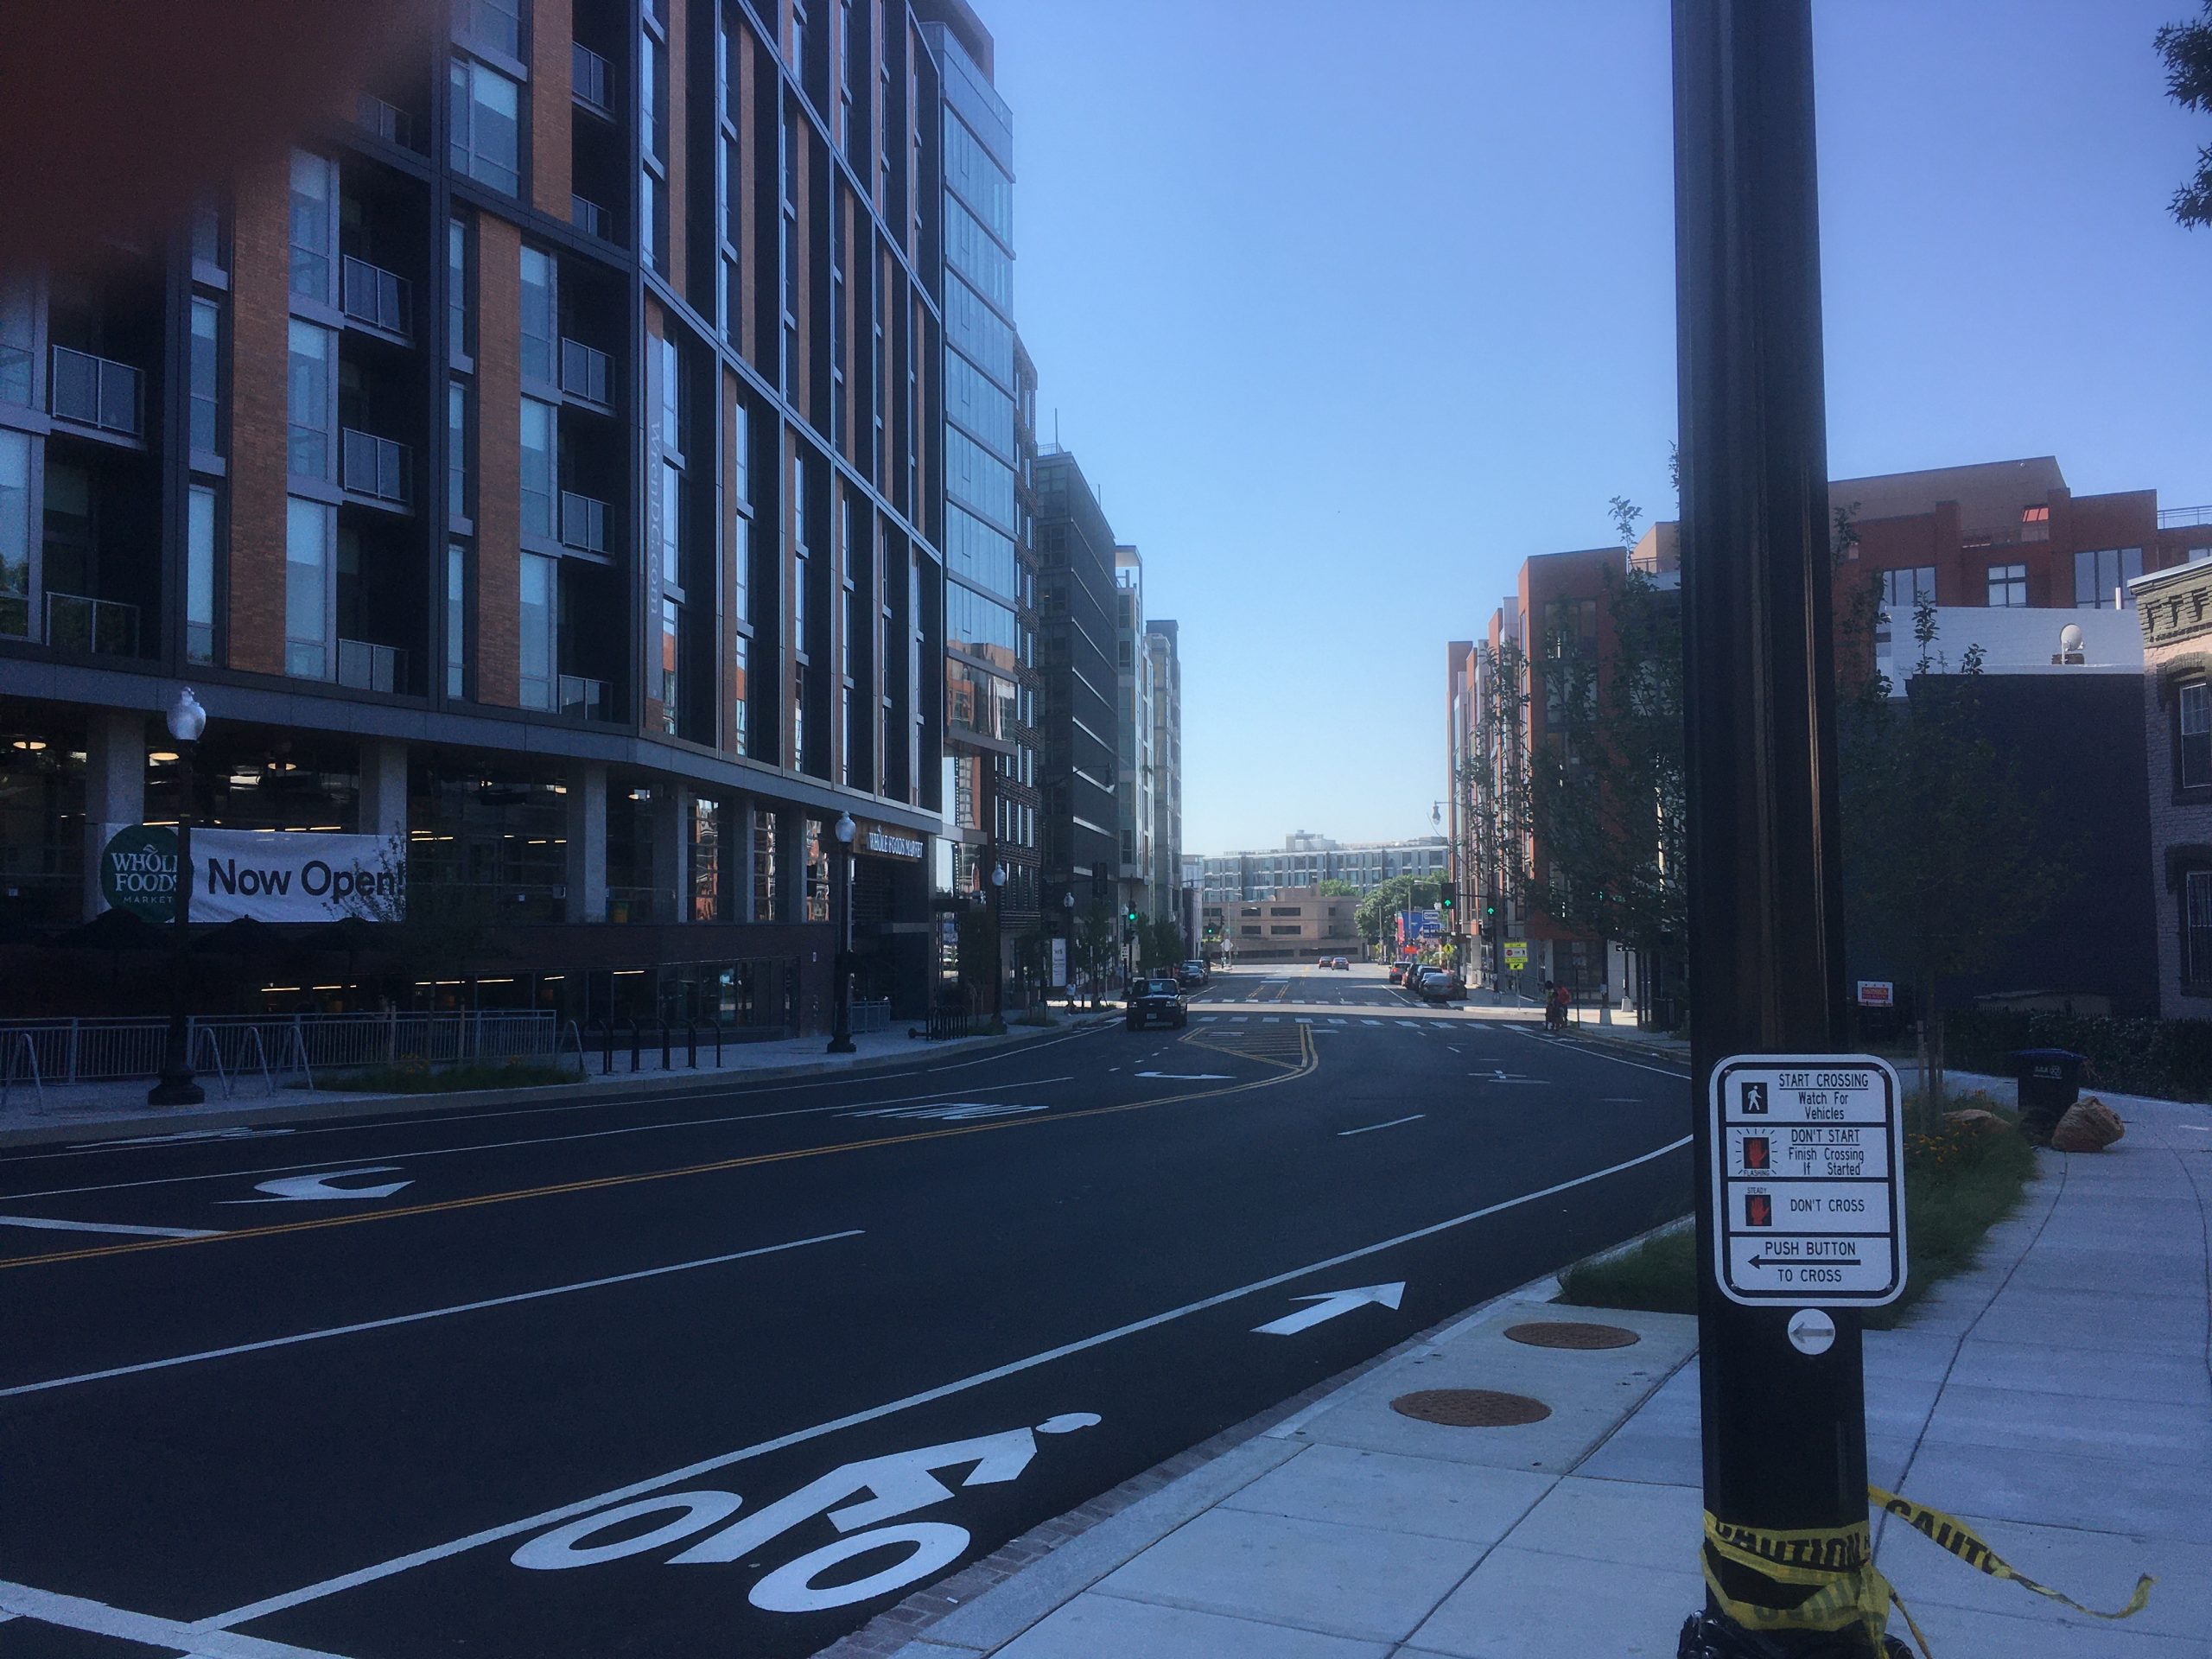
 The produce section was fine. I could find the things I wanted to find so it looks like a place that could serve my needs. There were some things there that I had zero interest in, what looked like fresh juice, I can’t say what they have special that the Logan Circle Whole Foods has or hasn’t. One thing that the Florida Ave location has that I haven’t seen at the Logan Circle one is self check out.
So my Bloomingdale, LeDroit Park and Truxton Circle neighbors rejoice, we have another choice in grocery shopping.
*Better meaning I don’t have to deal with Logan Circle. Better if coming from Truxton Circle or Bloomingdale.
The Triangle Known as Truxton Circle: Beans!
Back in 2017, I and two artist neighbors set up an exhibit at 410 GoodBuddy called The Triangle Known as Truxton Circle. I have a few things sitting on my computer from the exhibit that I’d like to share. Between no childcare and attempting to telework in less than ideal conditions, yes, I’m not posting much. But I can post this from the exhibit.
BEANS!
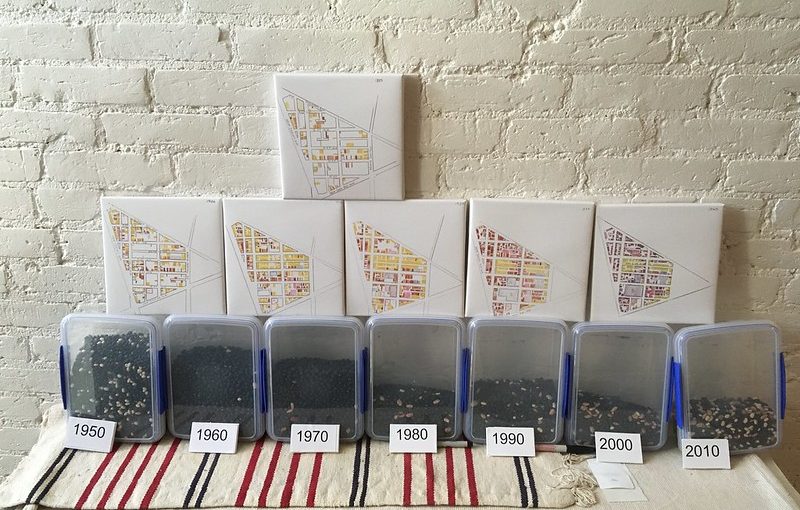
2016, Mixed MediaThis picks up where Change 1880-1940 leaves off. Each bean represents a single person. Each container represents a census year. Each year is different.
Compare the different years.
What is going on here?
Why do you think some years have more people than others?
The neighborhood continues to transform.
So hopefully you’ve read the previous blog post Change 1880-1940, which were a set of maps showing patterns of households in Truxton Circle by race. Since the 1950 census wasn’t out (it will come out in a few years), I could not create a map. Brian Bakke, one of the artists in the show, suggested I show (somehow) what happened after 1940. I came up with Beans!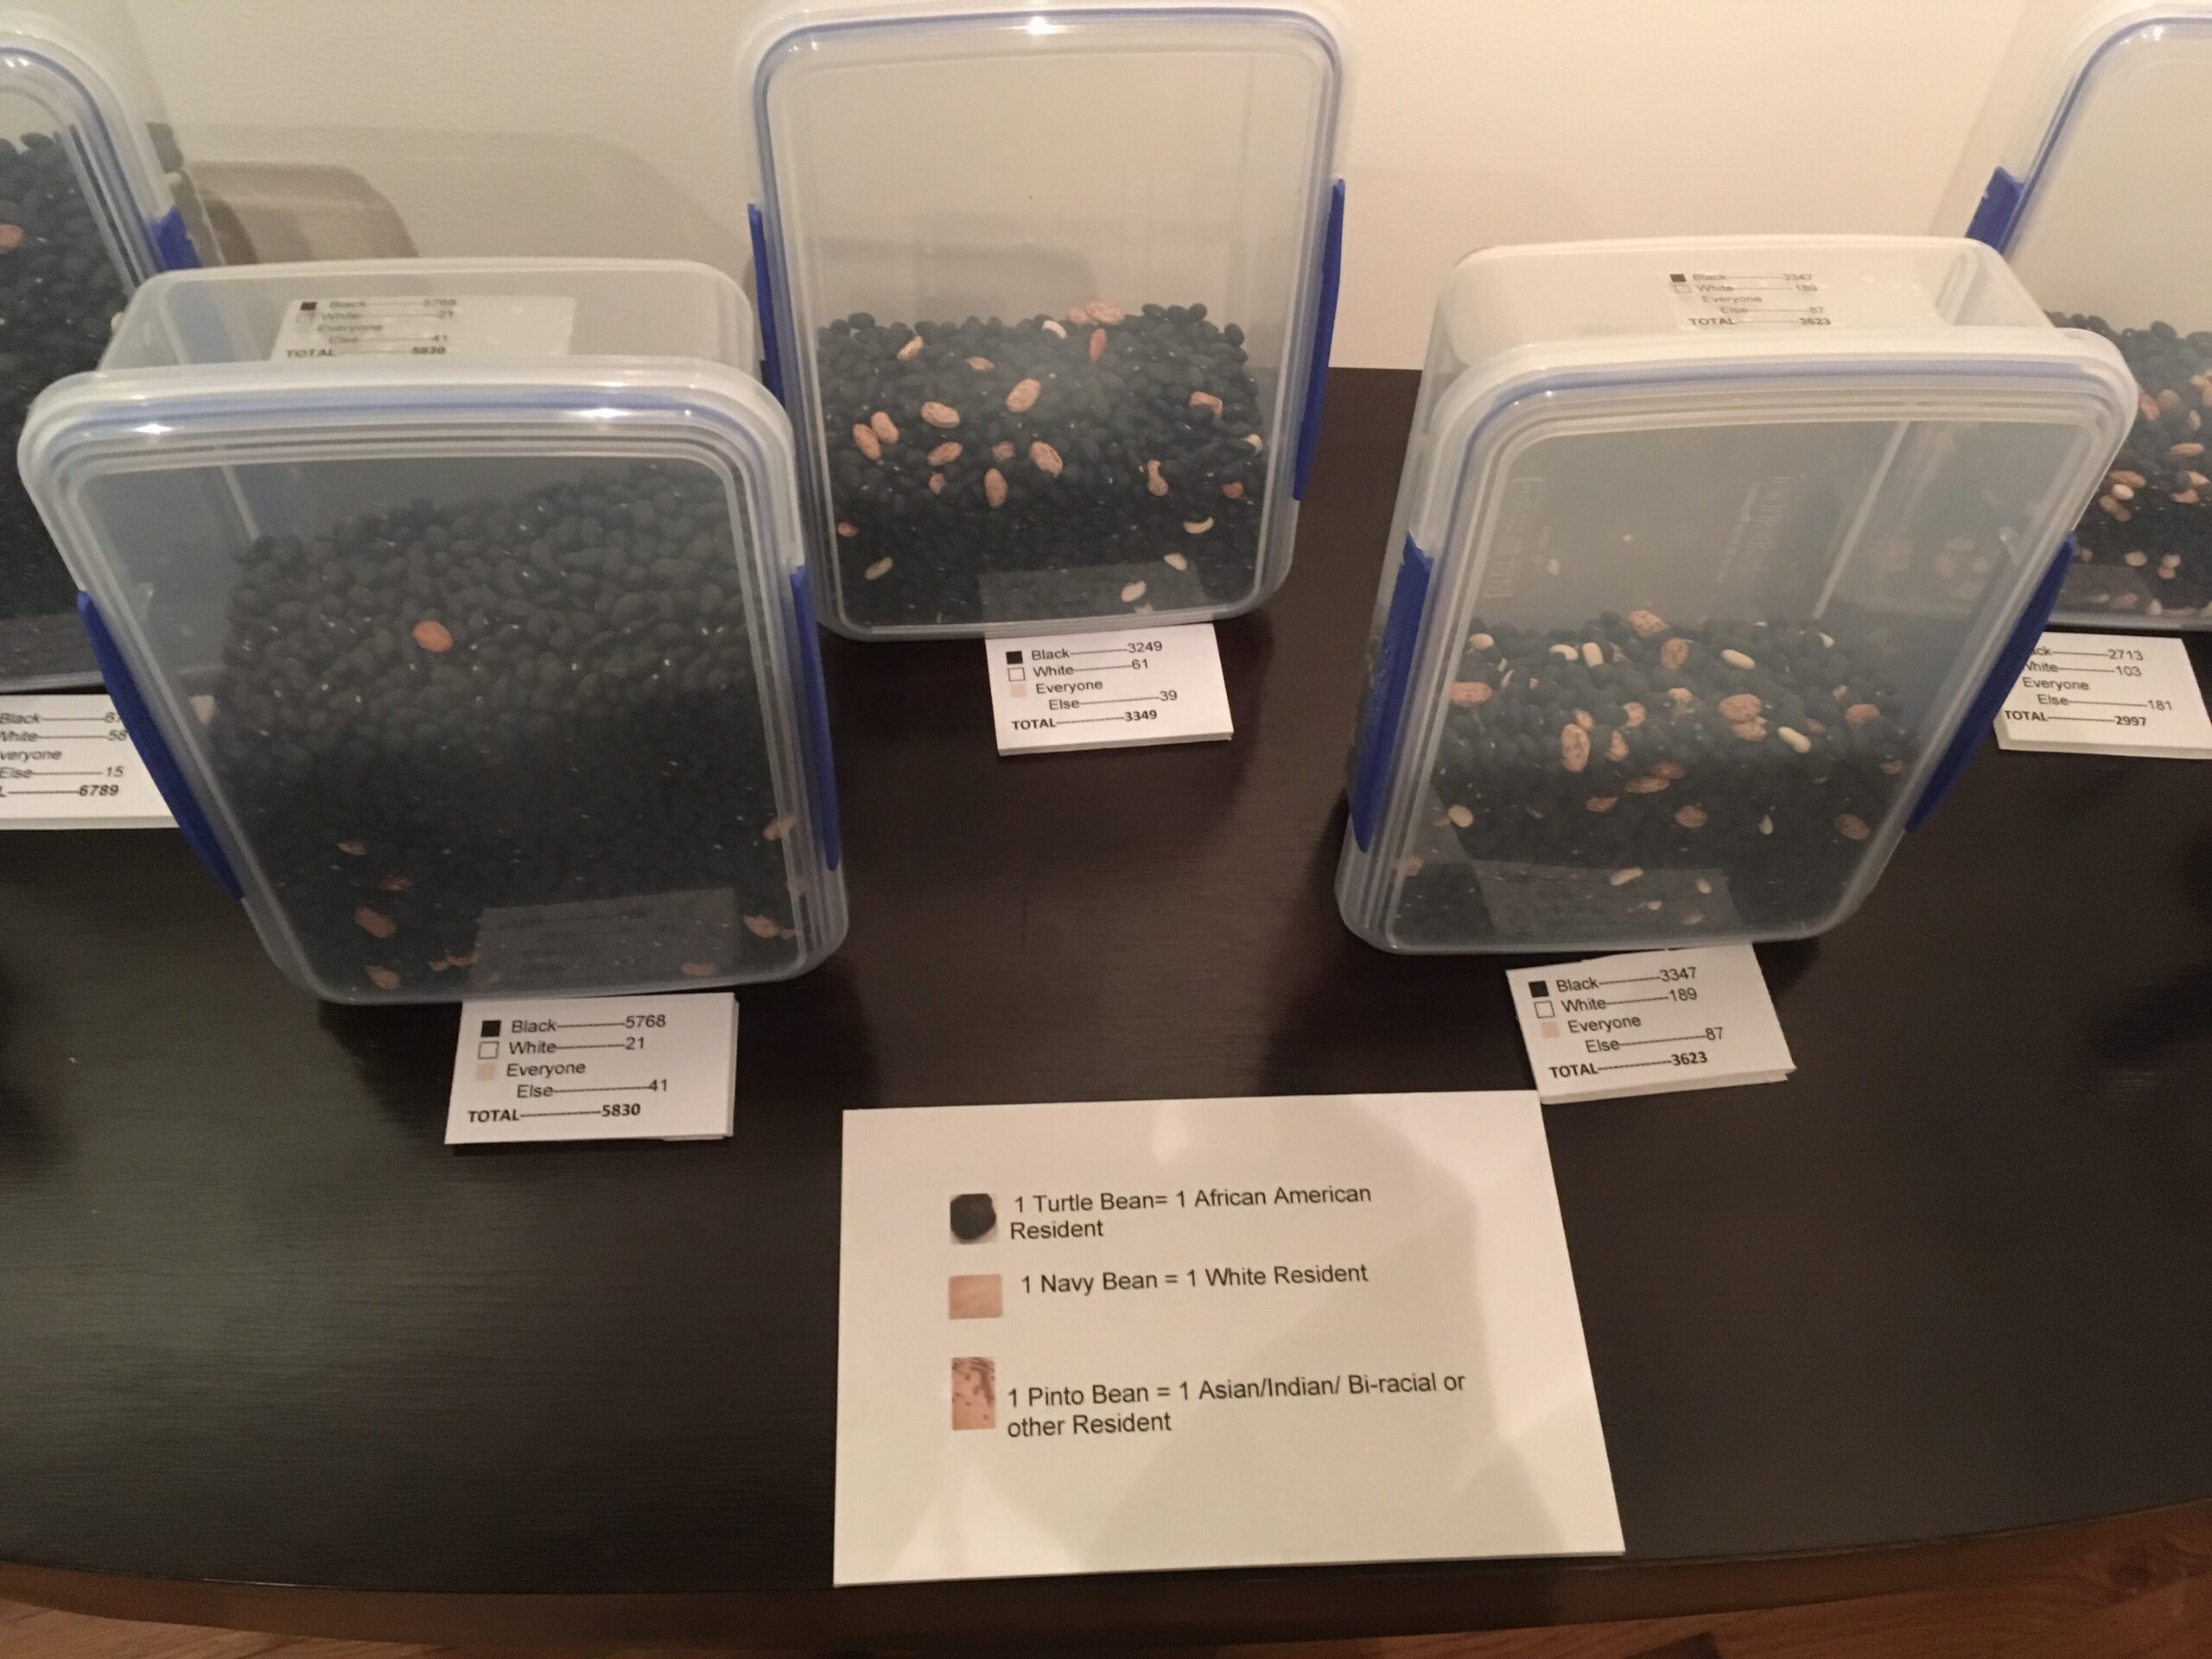
I could figure out easily how to show Black and White individuals. Black beans and white Navy beans. For everyone else, that was a struggle. I had to find a bean that was around the same size as the other beans AND visually different from the Navy beans. That wound up being the Pinto bean.
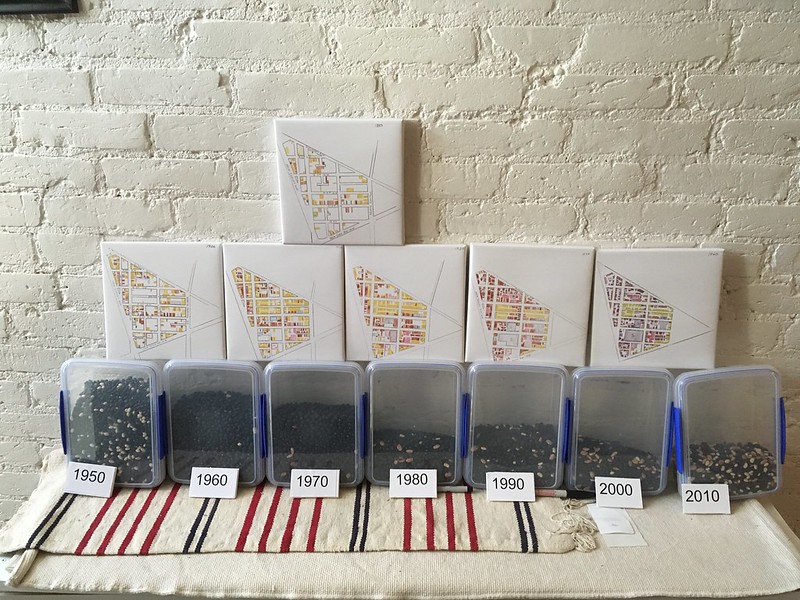 Looking at the various containers of Beans! the neighborhood is almost exclusively African American in 1960. And you may notice the number of residents (each bean represents one person) from 1950 has decreased a little bit by 1960. In 1970 the number goes down a bit more, but you might not notice. By 1980 the number of residents had significantly decreased in a noticeable way.
I remember being asked why was the population going down. There are various reasons, but the one I mentioned was the role of women changing. In 1950 African American kids were more likely to be raised in a two parent household than not, with mom at home. Here come the late 1960s and the Sexual Revolution and households got smaller. Women have less pressure to get married and have kids, or have kids at all.
There is also another change in the 1980s, a lot more other racial categories than Black or White show up. So more Pinto beans. By 2010 it is a whole bean soup mix melody.
The Triangle Known As Truxton Circle: Change 1880-1940
Back in 2017, I and two artist neighbors set up an exhibit at 410 GoodBuddy called The Triangle Known as Truxton Circle. I have a few things sitting on my computer from the exhibit that I’d like to share. Between no childcare and attempting to telework in less than ideal conditions, yes, I’m not posting much. But I can post this from the exhibit.
I believe this was part of Beans!, which I will get to later. I really love Beans! But you can’t appreciate Beans! until you’ve seen the maps.
Change 1880-1940
Digital print on canvas
I used US Census and city directory information to show changes in the neighborhood from 1880 (the first census with street addresses) to 1940 (the latest open census). The census is taken every 10 years.
Compare the different years, and see how the neighborhood fills in.When does the neighborhood transform into a majority African American neighborhood?
Please go to BEANS! to see the continuation of the transformation.
Unlike my other Triangle posts I’m going to go a bit more into the images.
Okay the key for all these maps is:
Yellow- Whites
Brown- African Americans
Green- Asians- usually Chinese
Blue- Government facilities, if filled with brown- Black school
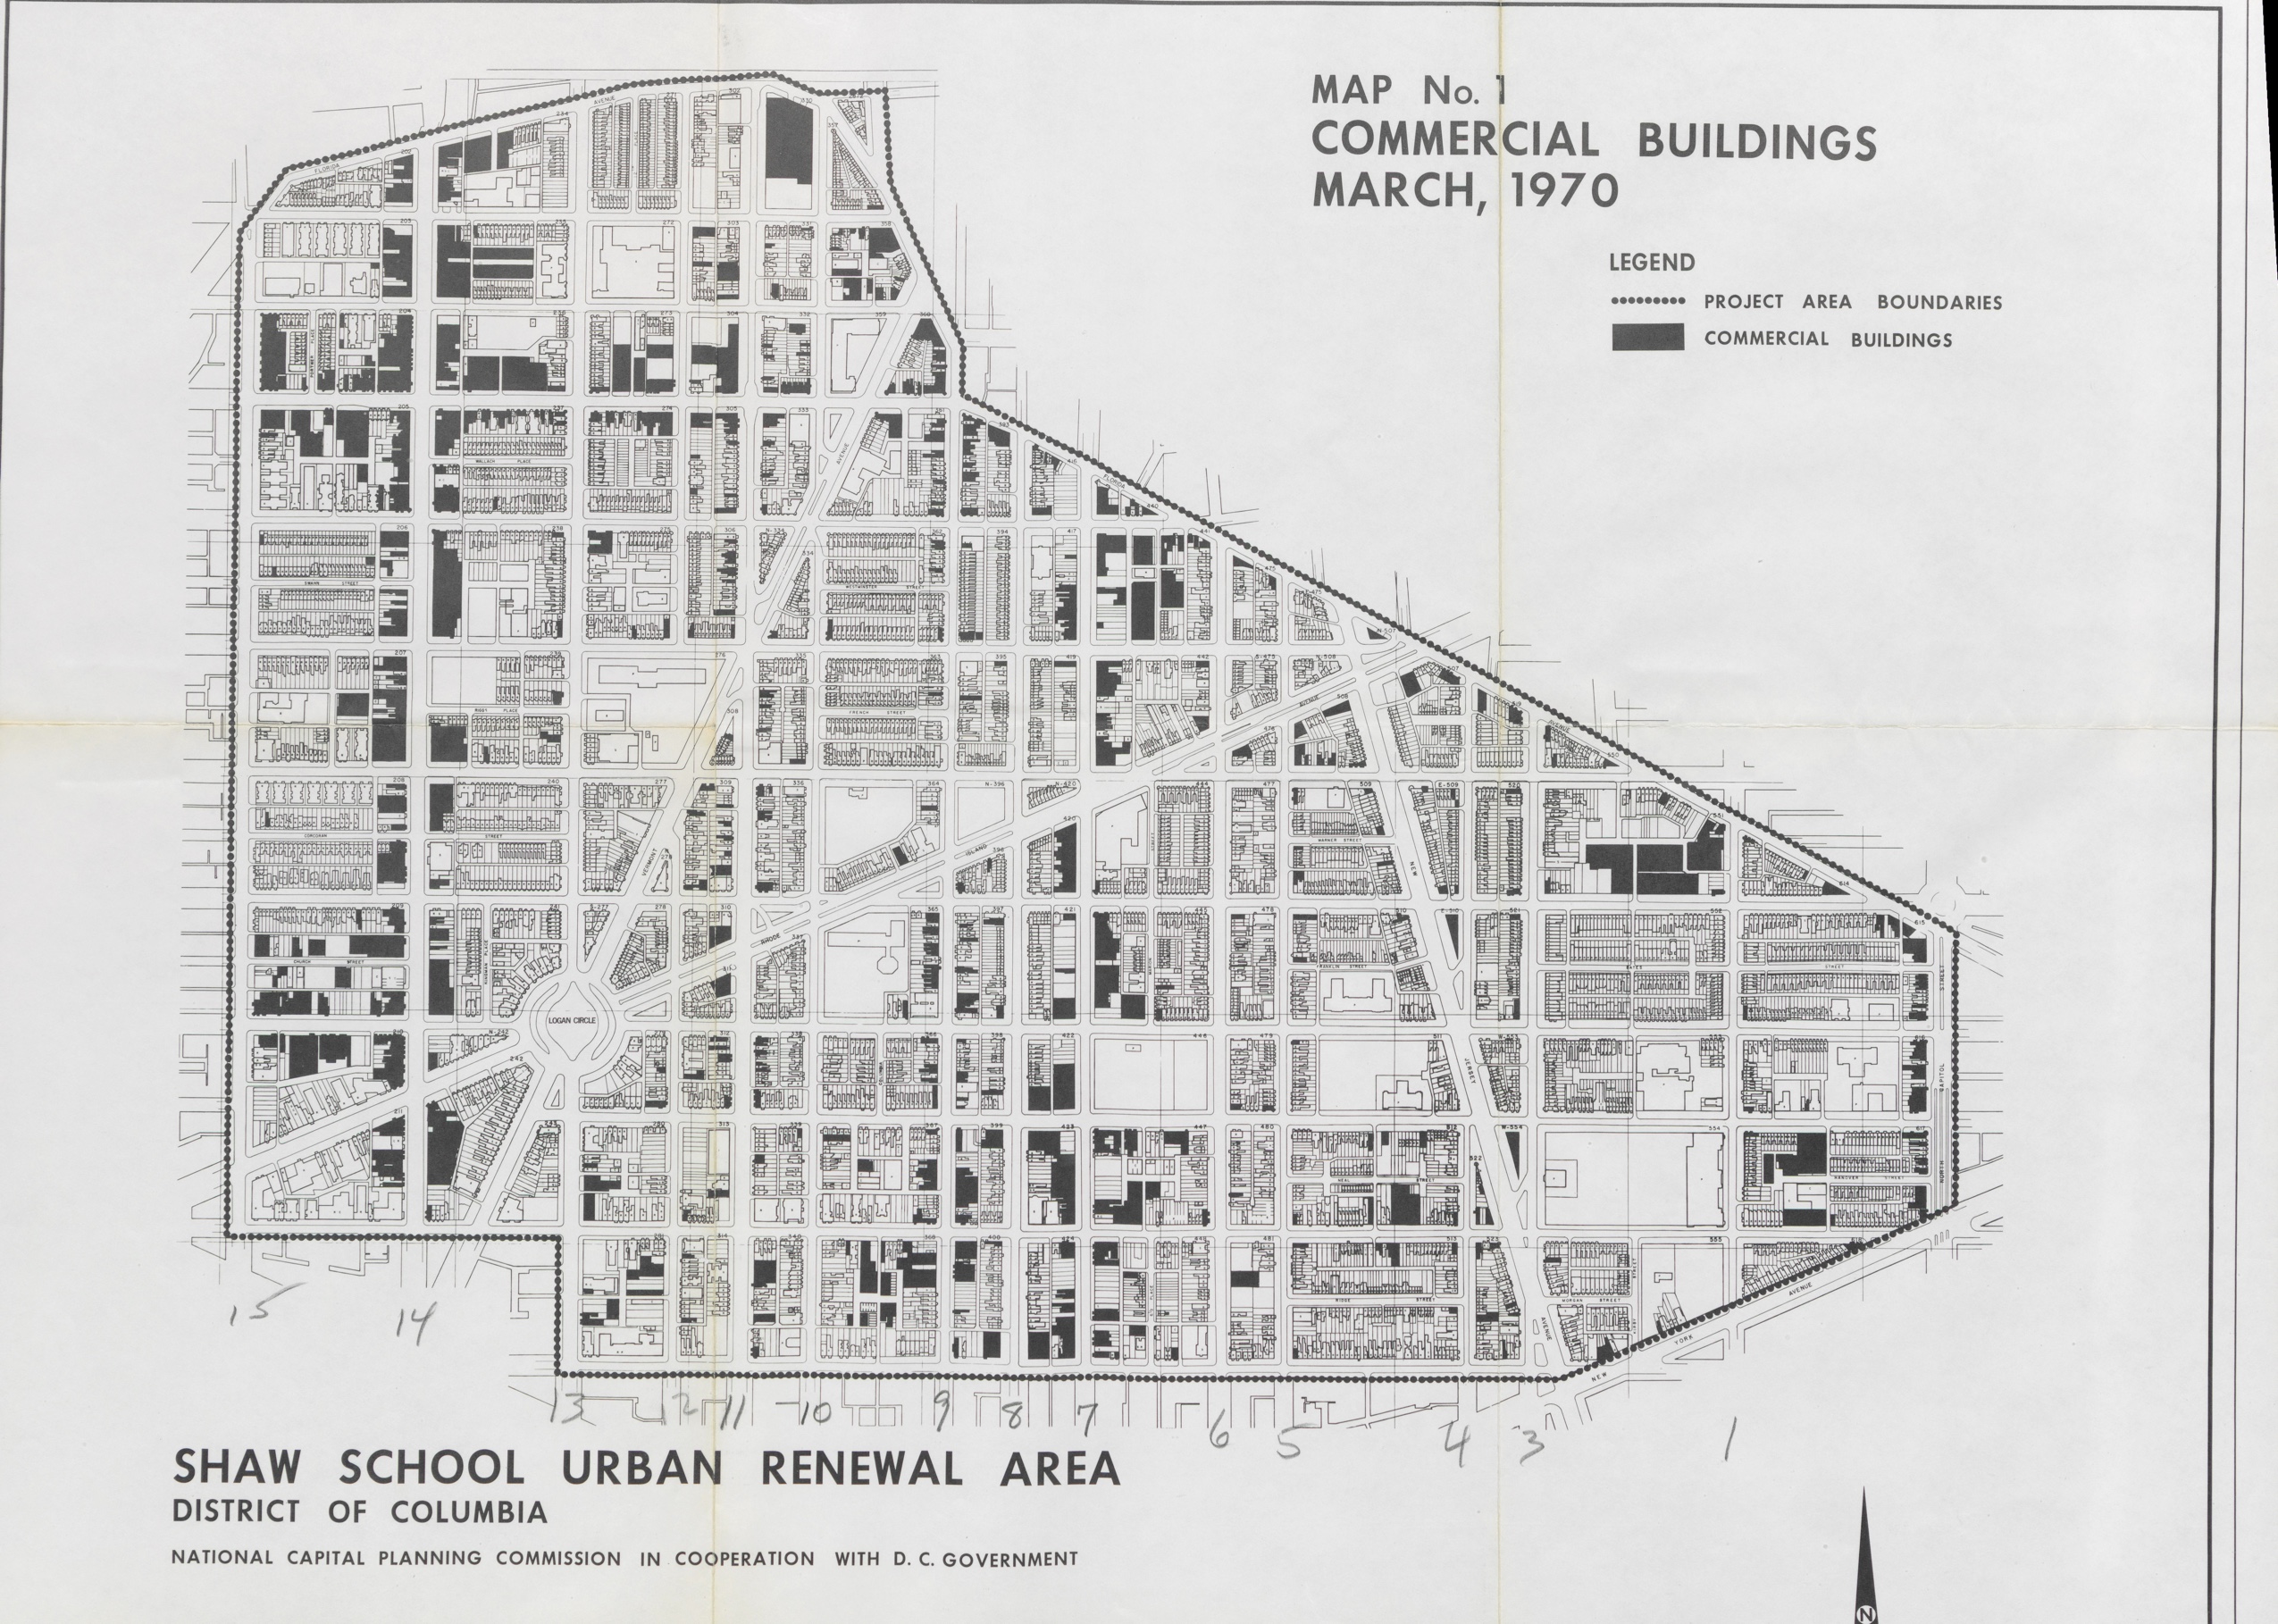
Purple- Commercial property

This is where black and white residents lived in the northwest part of what is now known as Truxton Circle in 1880. It is a mostly white and lightly populated neighborhood.
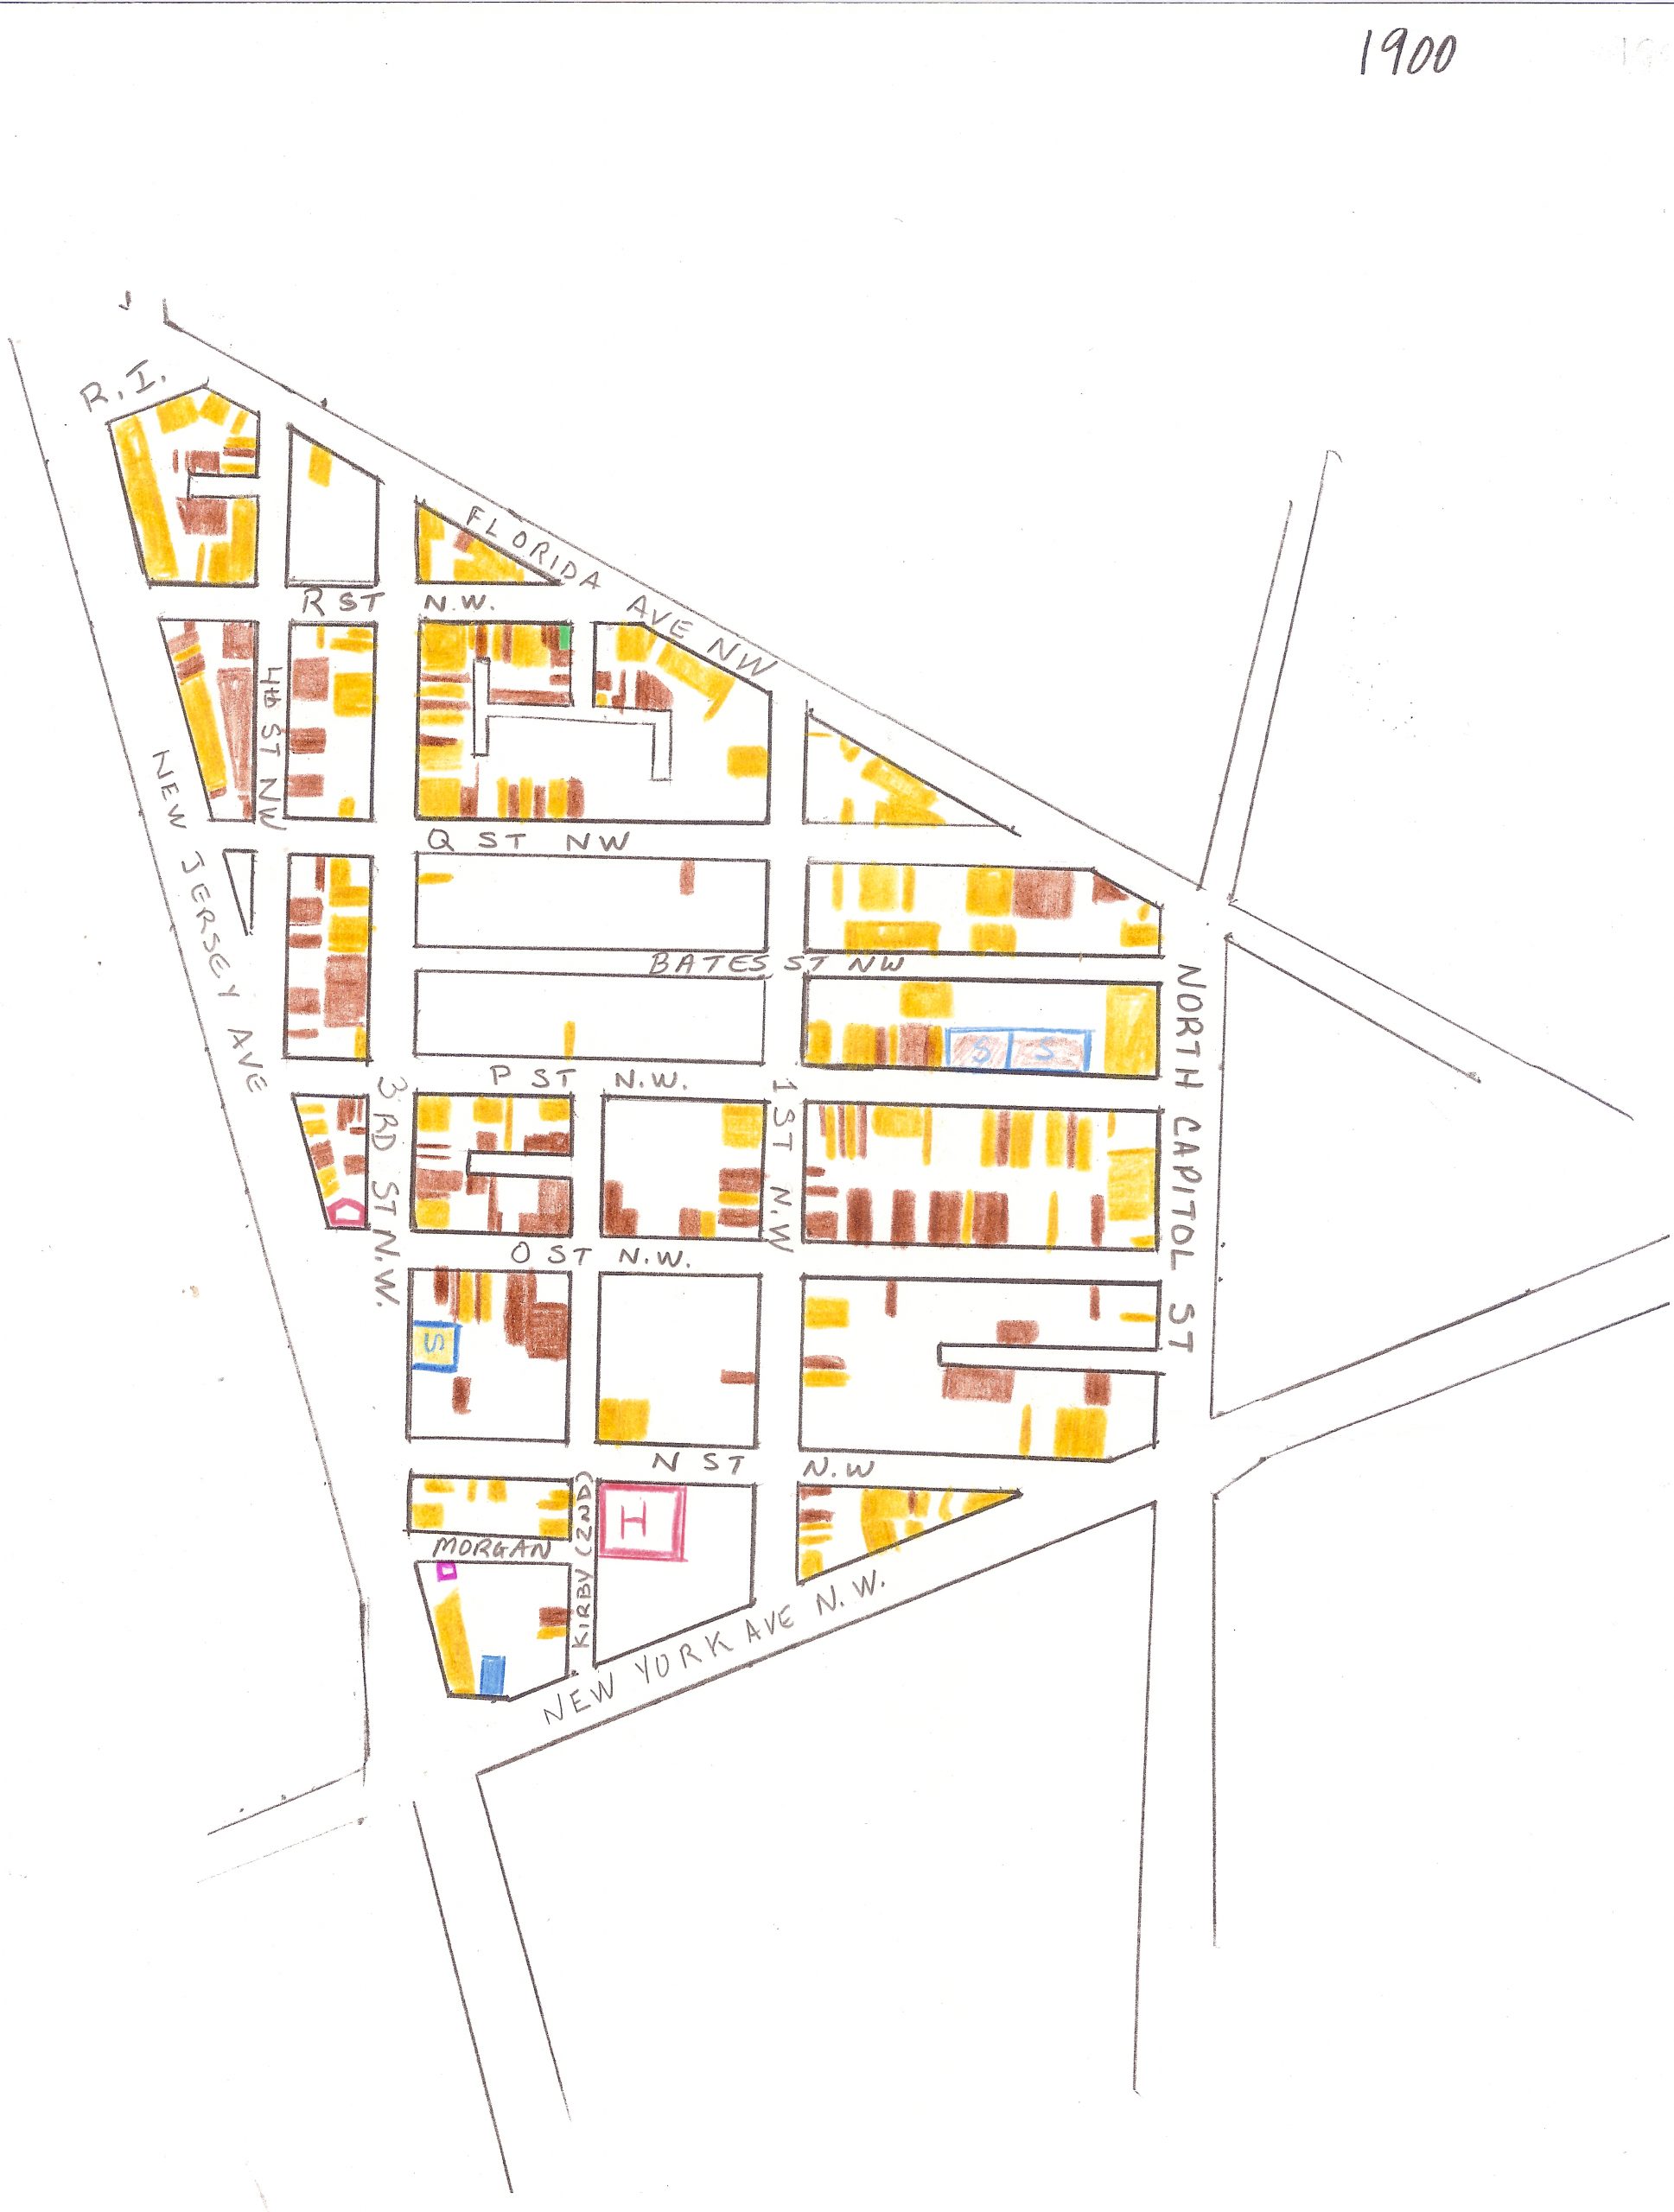 So these maps are based on the US Census and the 1890 census got burned so, there is no 1890 map. So by the time 1900 rolls around as seen above there have been some big changes. There has been more development, more housing and businesses, and there is a hospital between N St and New York Avenue. Langston and Slater appear over on the unit block of P Street. So students who were not served by the white school on 3rd St, have options. The Black/White population looks kinda even, but it isn’t. The TC is still a majority white neighborhood.
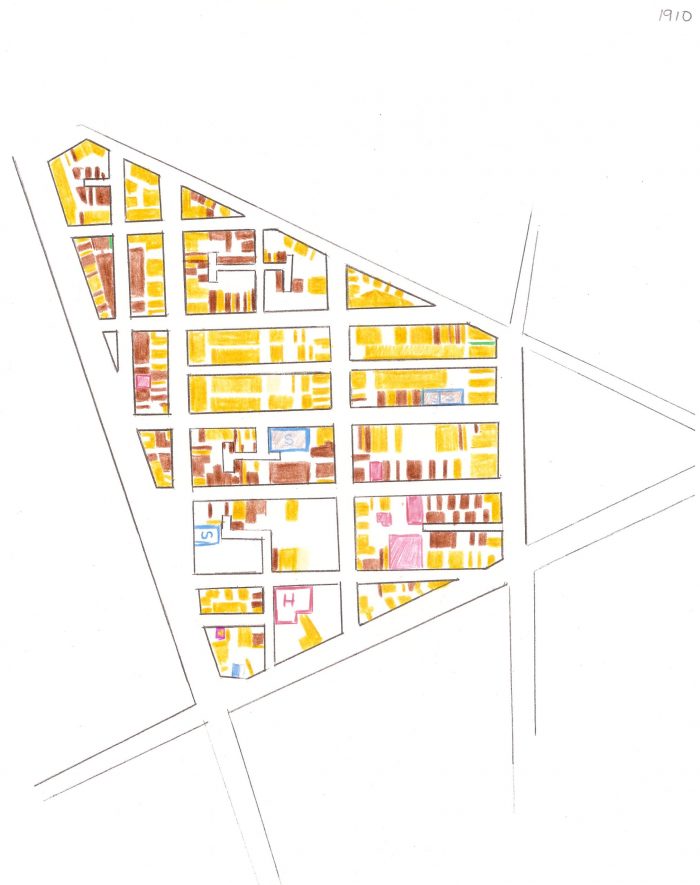 In 1910 the neighborhood has filled many of it’s empty spaces with white households, which is still the majority.
 You can’t see it from the map but the African American population is growing. A bit crowded in the units they occupy, but growing. 1920 is the last year the non-Black population is the majority. By 1920 three more schools for African Americans appear. And then Boom.

1930!
This is where the neighborhood finally becomes the historically Black neighborhood we all know and love.
 Yes, 1940 looks different. What is brown looks purple. As you can tell this map was made at a different time. It was made quickly and specifically for the exhibit, and thus, not as good as the others. As 1940 was the last open Census available where I could say what racial group lived at what particular address, this is the last map.
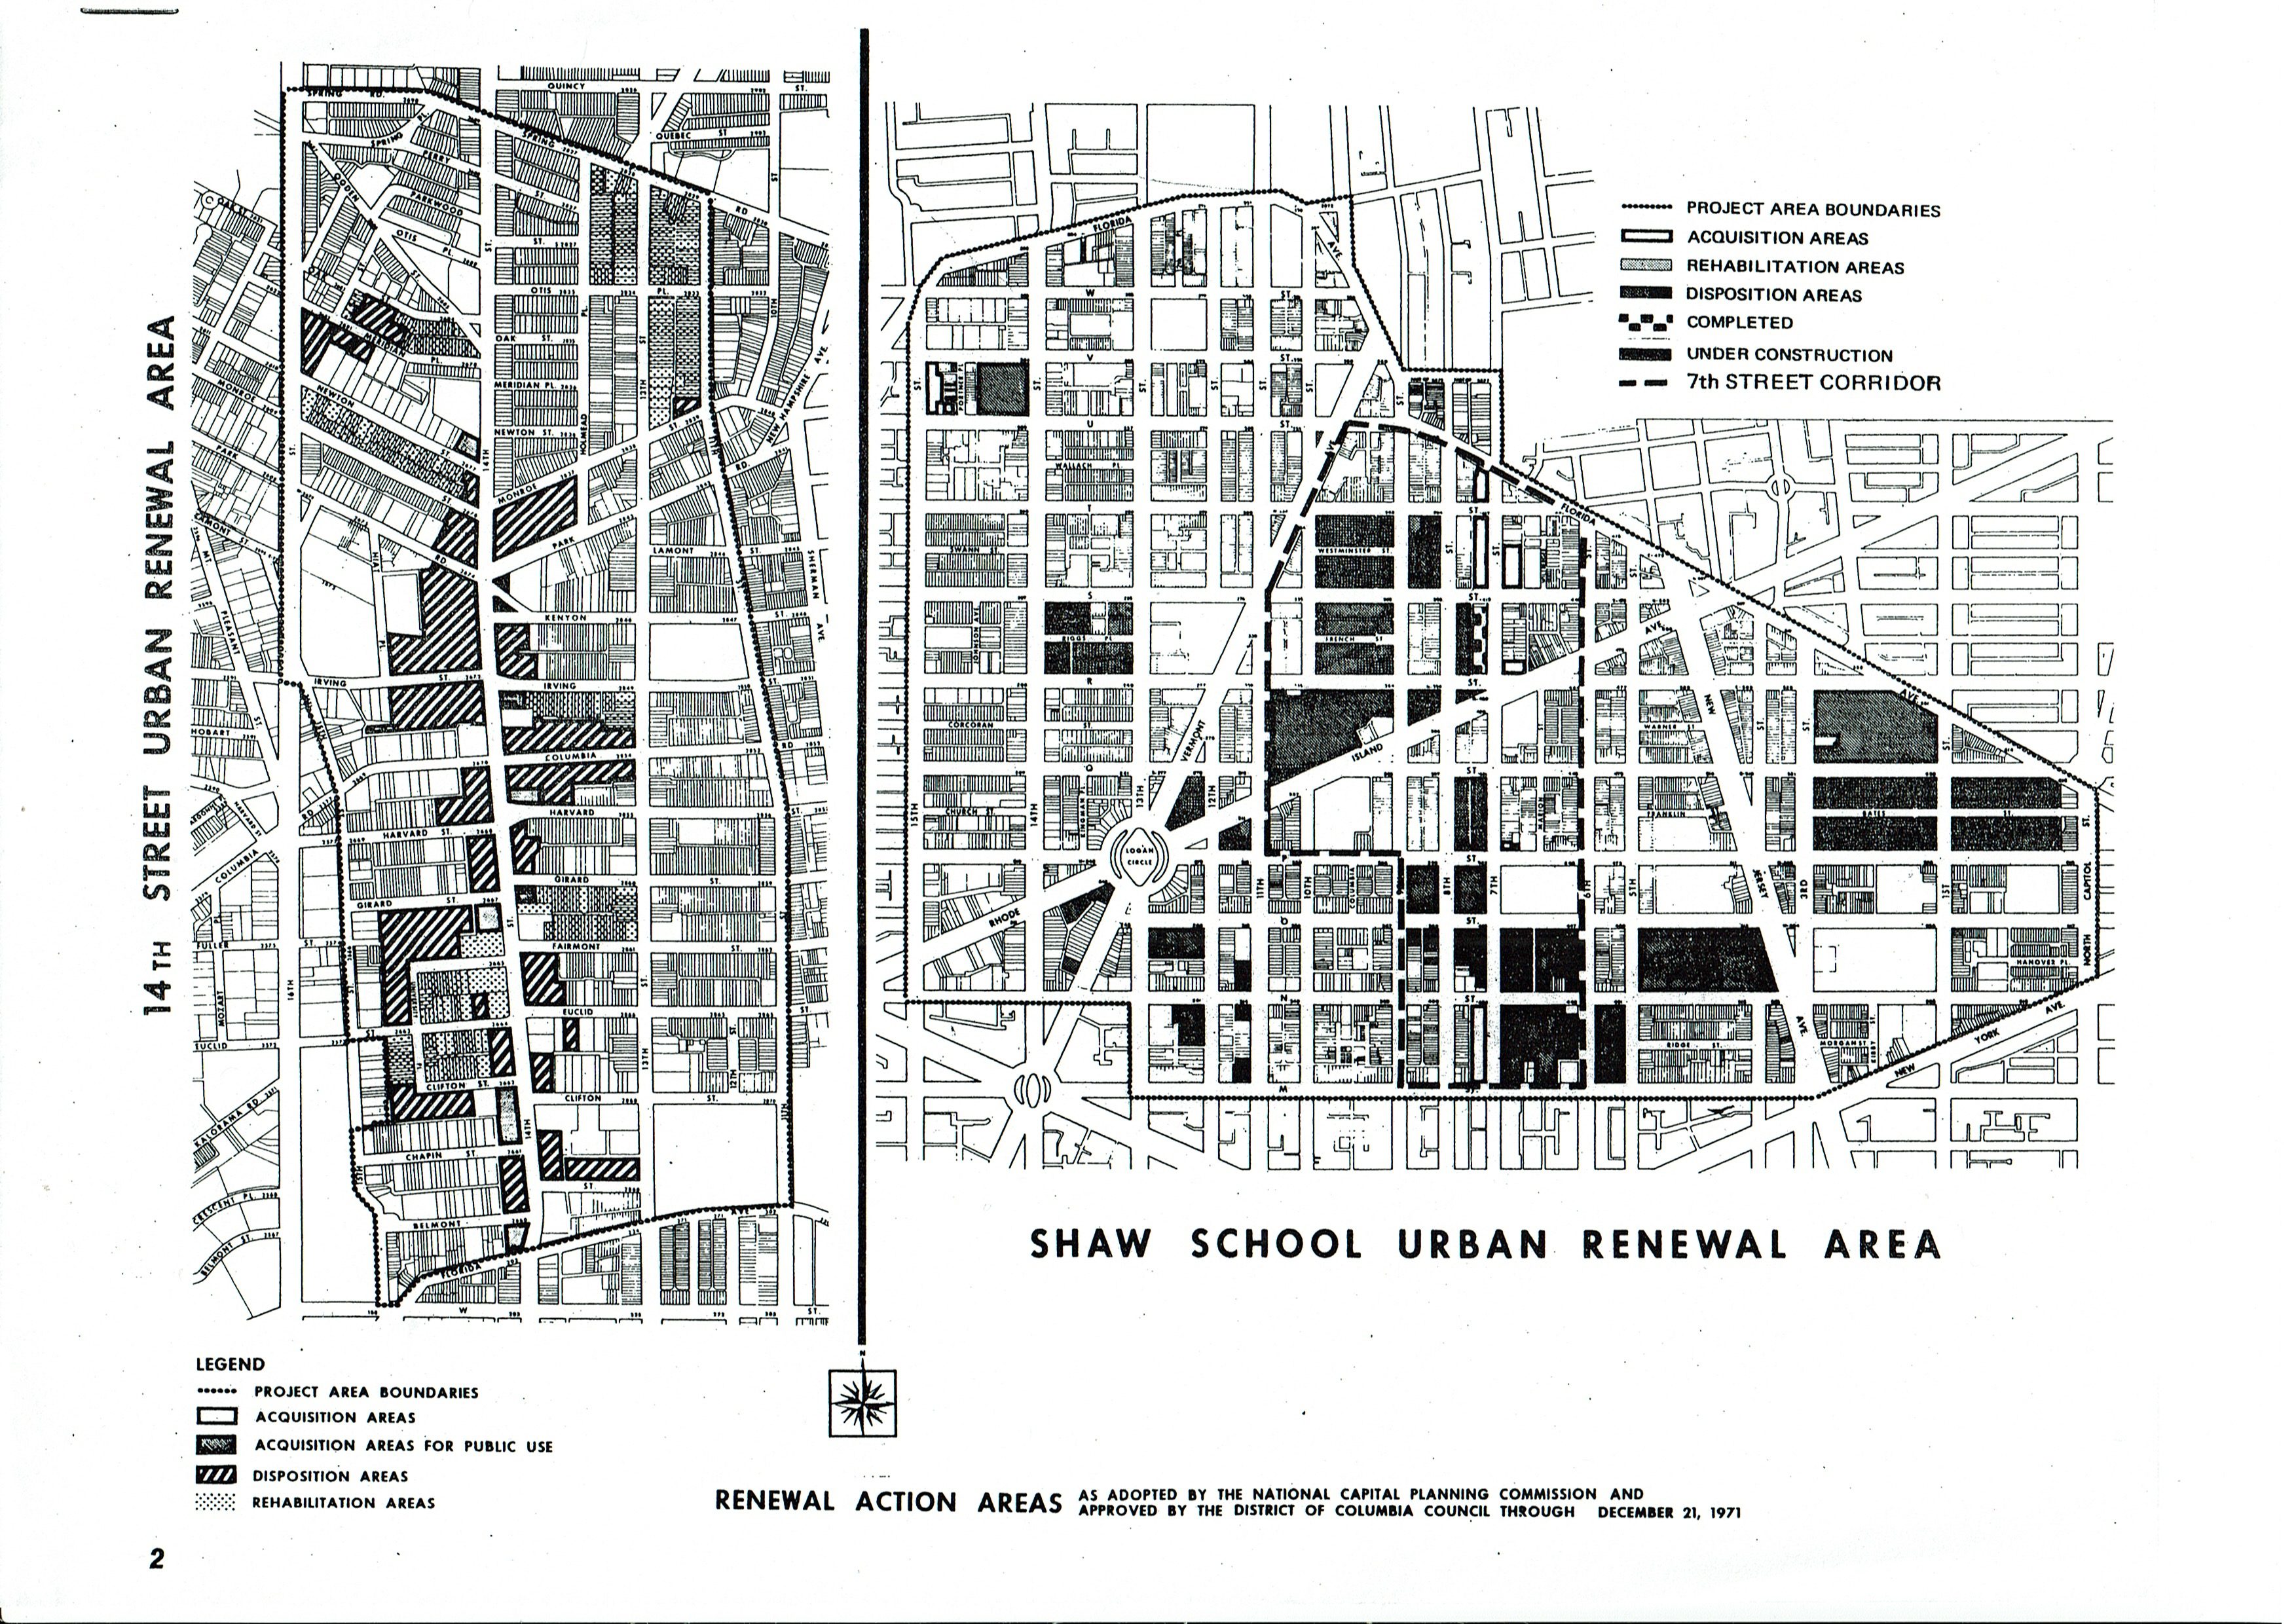
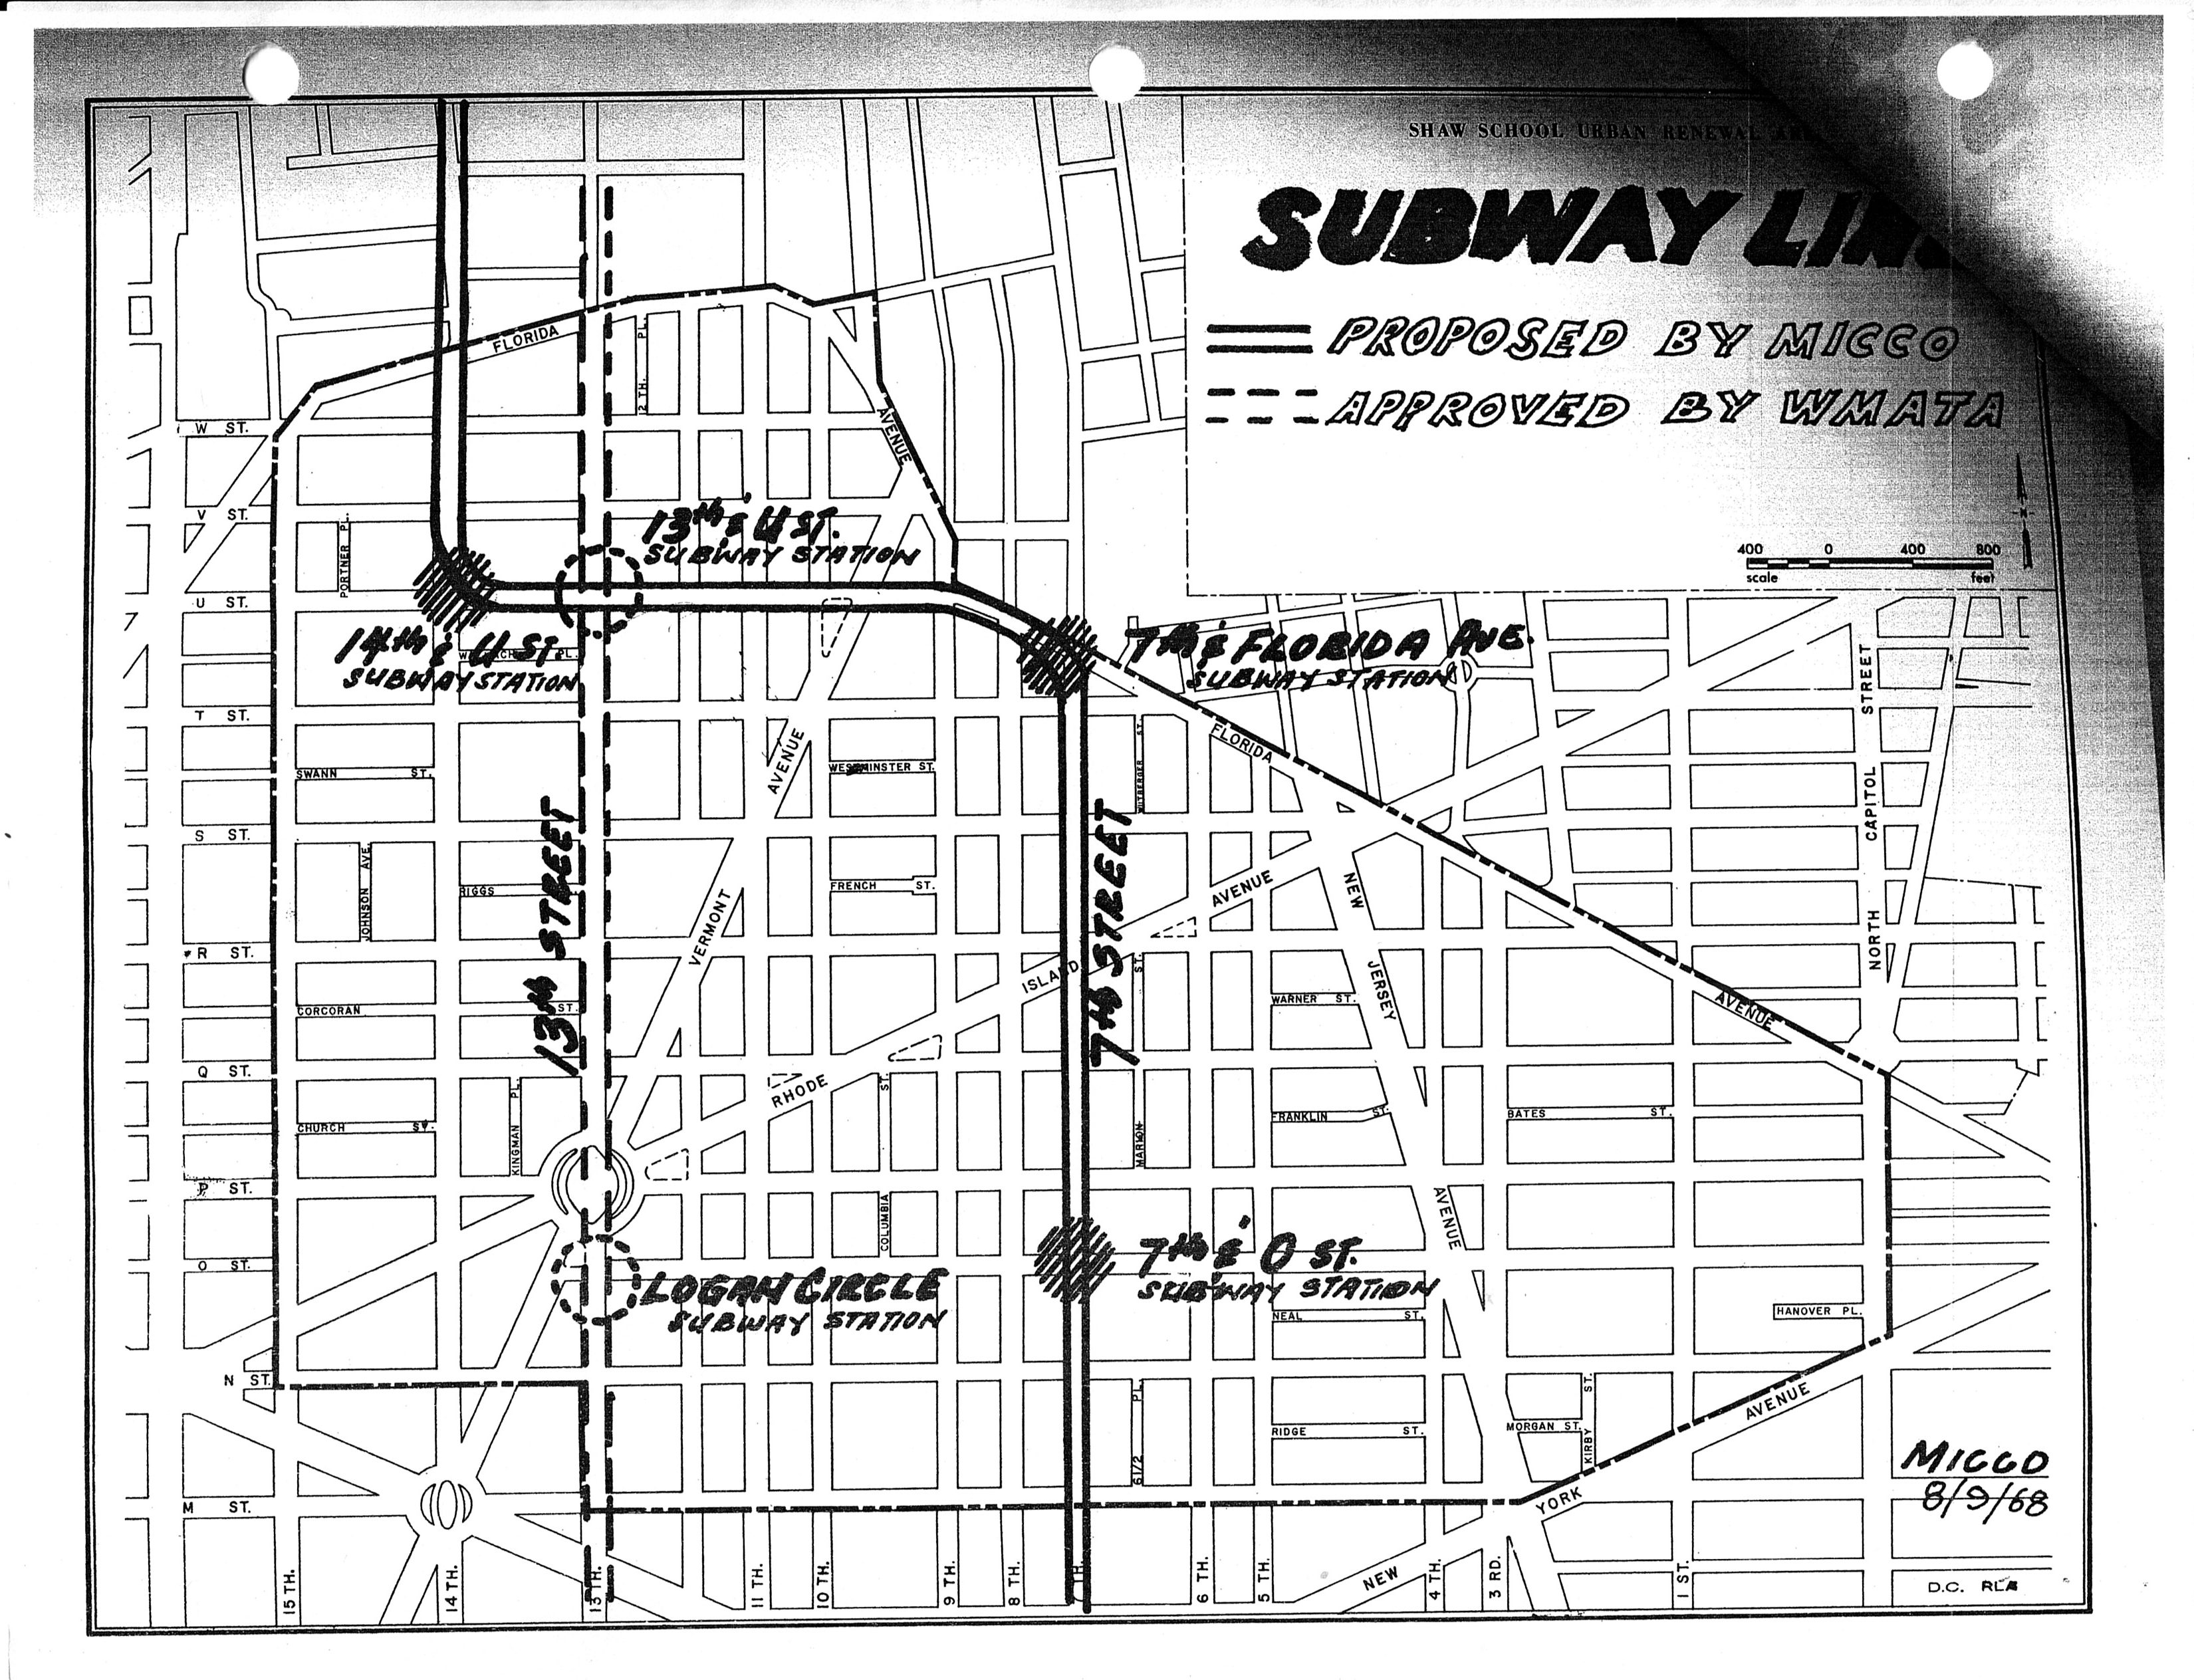
Once again- The historical boundaries of Shaw
Okay so there is a write up in the Washington Post about Shaw. I’m debating about giving Alex Padro a hard time about the east boundary being New Jersey Avenue. Their graphic has Shaw’s western boundary at 13th St NW and the southern part just eats up Mt. Vernon . The boundaries of Shaw keep changing with each article so, there is that. This is a Real Estate article, and they quote Padro and Ibrahim Mumin, so I’m not going to nit pick much, except for this point.
Anyway, here’s a map
 and this gem
and this…
The Triangle Known As Truxton Circle- Frankenmaps
Back in 2017, I and two artist neighbors set up an exhibit at 410 GoodBuddy called The Triangle Known as Truxton Circle. I have a few things sitting on my computer from the exhibit that I’d like to share. Between no childcare and attempting to telework in less than ideal conditions, yes, I’m not posting much. But I can post this from the exhibit.
Below are two maps I created from older maps. The thing was none of the old fire maps had Truxton Circle on one map. I had to piece the maps together from several maps, just as Dr. Frankenstein pieced together his creature. I sold the older view of the TC and have kept the 1919 map for myself.
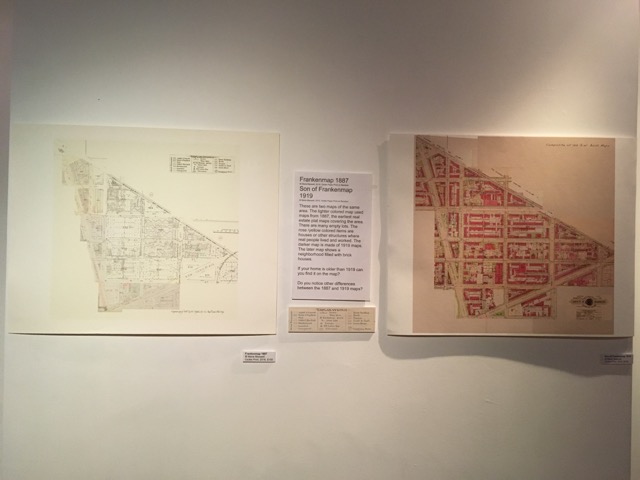
Frankenmap 1887
2016, Giclée Paper Print on Bamboo
Son of Frankenmap 1919
2016, Giclée Paper Print on Bamboo
These are two maps of the same area. The lighter colored map used maps from 1887, the earliest real estate plat maps covering the area. There are many empty lots. The rose /yellow colored items are houses or other structures where real people lived and worked. The darker map is made of 1919 maps. The later map shows a neighborhood filled with brick houses.
If your home is older than 1919 can you find it on the map?
Do you notice other differences between the 1887 and 1919 maps?
Paint it Black
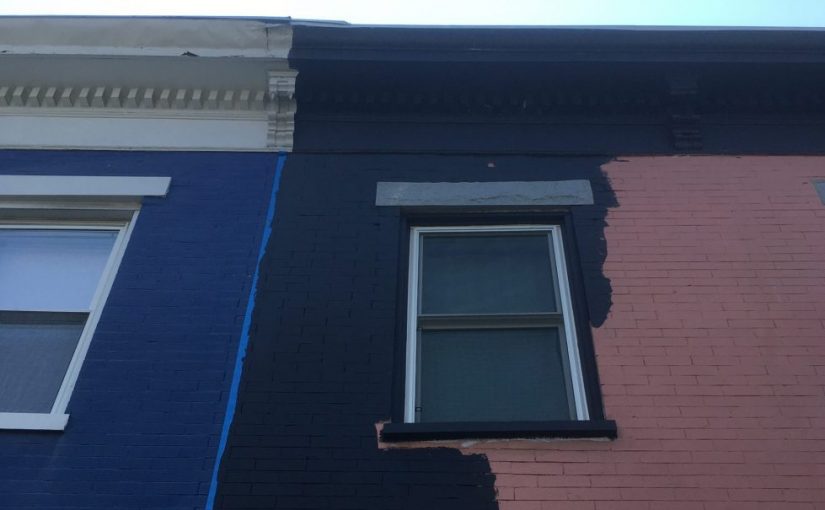
I like having an orange (okay more creamsicle) house. In instructions to delivery people, because Google and other map things are screwing it up, is that if you aren’t delivering to an orange house, you have the wrong house. It isn’t like there are a lot of orange houses. But we’re getting the house ready for sale, so the orange has to go.
But something happened. As you can see from the upper (or featured) image it got painted black. This is not a color known to make houses sell like hotcakes, unless the market is full of Goths.
There was some miscommunication.
I’m sure this will get corrected and house painters have to give a wall a few coats of paint. So this one coat should be fine. I hope.
A black house is kind of cool, but not temperature wise. Black absorbs heat and as edgy and cool as I might think this would be (and a fun shock to the Realtor) the air conditioner wouldn’t appreciate it. I’ve seen other black houses in Truxton Circle, okay one. I wonder if those houses were painted black due to some miscommunication.
The Triangle Known as Truxton Circle: Stick a Pin in It!
Back in 2017, I and two artist neighbors set up an exhibit at 410 GoodBuddy called The Triangle Known as Truxton Circle. I have a few things sitting on my computer from the exhibit that I’d like to share. Between no childcare and attempting to telework in less than ideal conditions, yes, I’m not posting much. But I can post this from the exhibit.
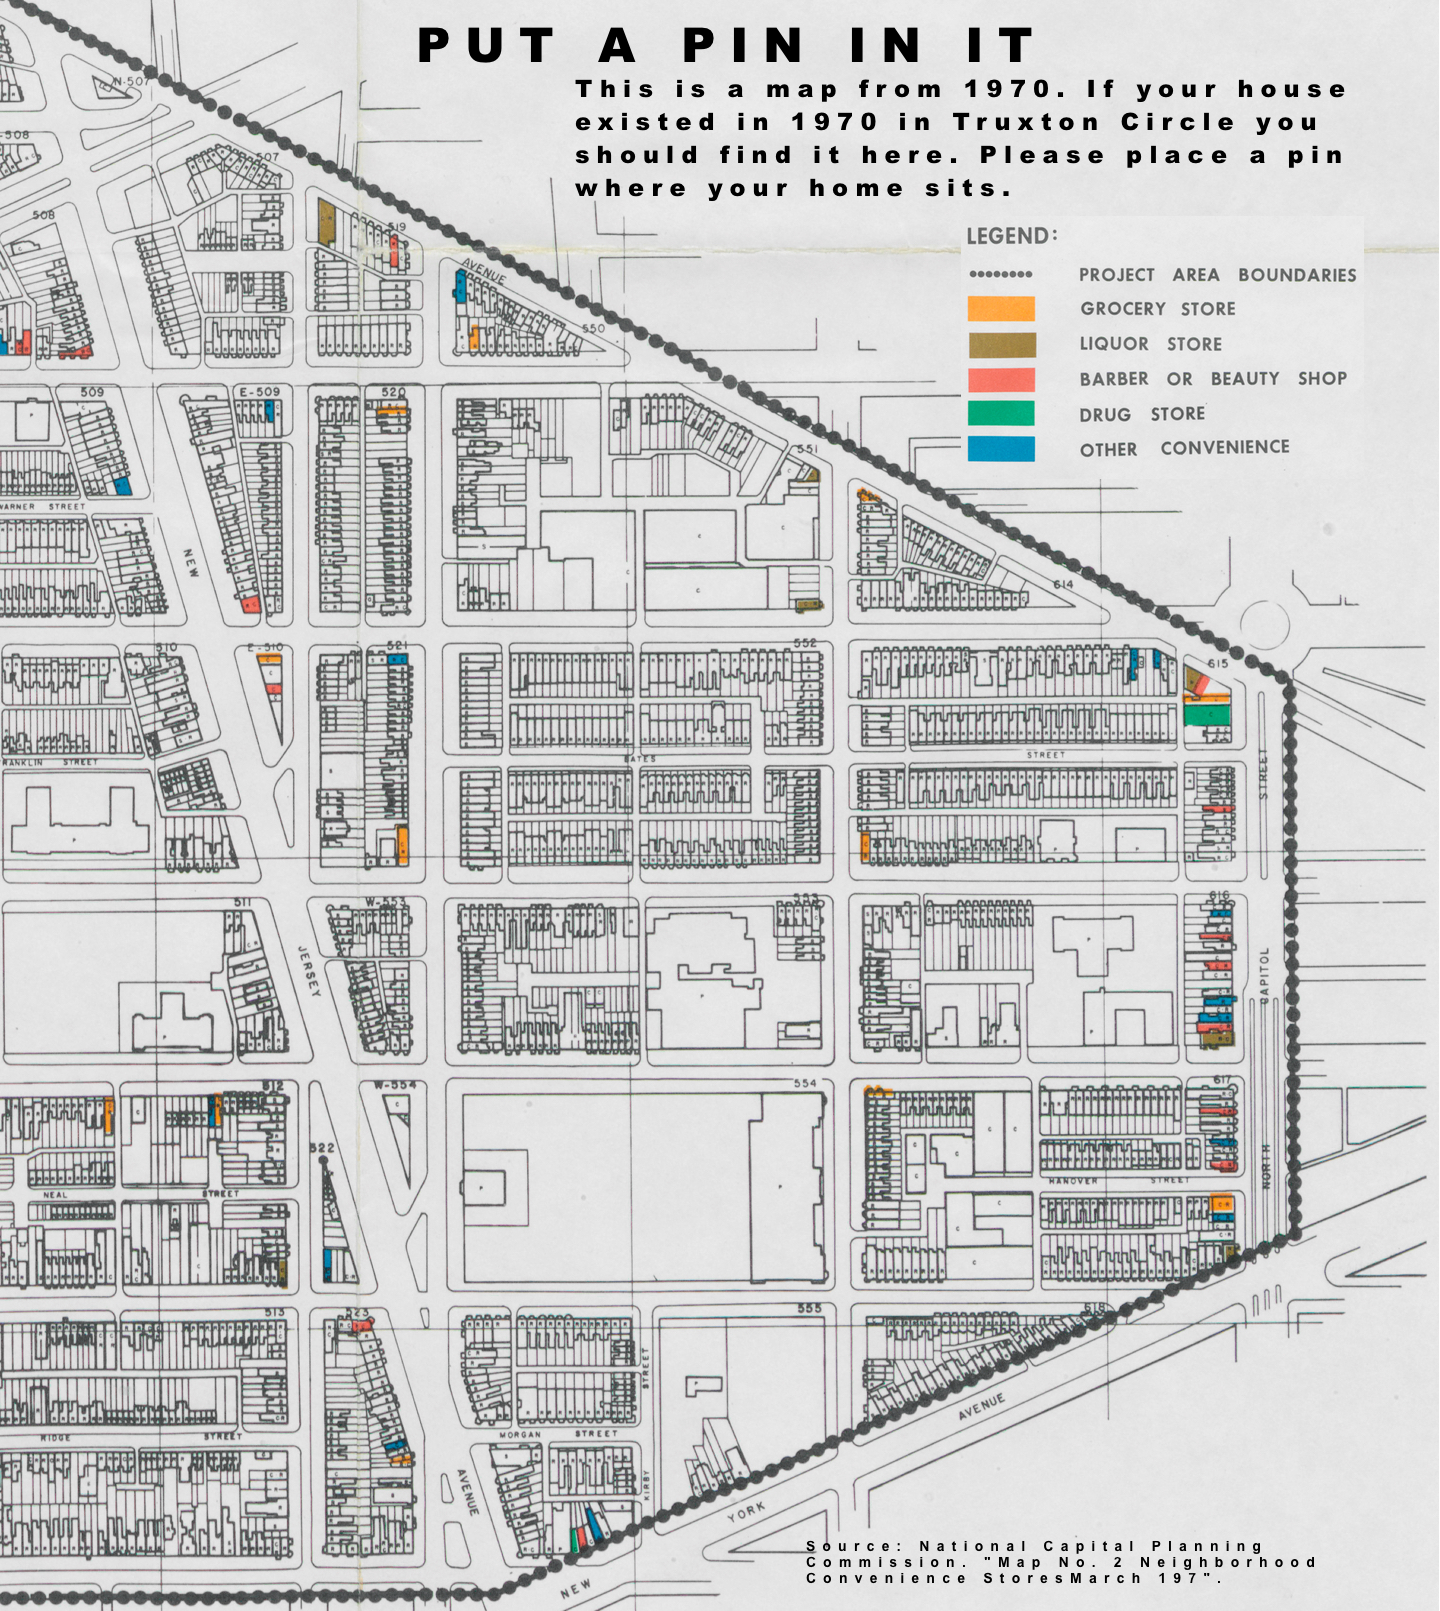
PIN ME!
If your house existed in 1970, please take a colored pin and stick it on your house.
One pin per household.