No comment about my last post? Nada? Okay, let’s get back to boring old Black Home Owners or Mari searches Ancestry and the Recorder of Deeds and maybe some old Washington Post/Washington Star articles.
Today’s subject is Allen Colbert the contractor, not to be confused with his son, Allen A. Colbert, the driver. In 1920 he lived at 78 P St NW (Sq. 616 lot 51). The current house on that was built in 1929, according to its real estate listing, and this Colbert family does not appear in the 1930 Census for the area. Besides, the senior Allen Colbert was 60 years old in 1920, so for this time period it is too much to expect him to survive to 70. Looking at the land records, it appears that Allen and his wife Mary or Marrietta were both dead by 1924.
In a loan document from 1924, the Colbert children, Allen A., James E. Colbert and Mary Colbert Brown paid off the debt on the property to the Northern Liberty Building Association. The Colbert’s had another daughter, Julia, but she does not appear in this transaction. I’m not sure what happened in 1925, but Orwin E. Howe was tasked with auctioning off the property for no less than $2,300. I’m not sure if this was to pay off more debts or if the property was just being liquidated. Then there is nothing until 1956 after Orwin E. Howe dies (1854-1935) and according to his will the property is transferred the property to the Dr. O E Howe Home for Unfortunate Girls. *start humming Poor Unfortunate Souls from the Little Mermaid.
Prior to 1920, Allen and Mary Colbert may have lived over on Cook’s Court between 3rd, 1st, R/FL and Q Streets, NW. In that 1900 Census, their surname was transcribed as Calvert and they had two minor daughters living with them. All the children in the 1920 Census hadn’t been born yet. In the 1909, under the name Colbert, Allen and Mary are at 1626 Cooksey Place NW. The similarities hint that this is the same family. In 1907, an Allen was at 118 Q St NW. Part of me is thinking the addresses probably moved around as much as he did.
Source: “Doctor’s Kin Gets $267,000 Estate: Provision made to Start Home for Girls.” 1935.The Washington Post (1923-1954), Dec 04, 15. https://search-proquest-com.dclibrary.idm.oclc.org/historical-newspapers/doctors-kin-gets-267-000-estate/docview/150595557/se-2?accountid=46320.
Today’s African American Truxton Circle resident from the 1920 Census who owned their home is the widowed Susan E. Brown of 237 O St NW (Sq. 553, lot 58). This address no longer exists, and is currently an empty lot behind the Friendship-Armstrong Charter School. In 1920 she lived there with her son William J. Brown and her daughter Alethya’s family, the Williams.
In the Recorder of Deeds’ records Mrs. Brown was also Susan E. Berry (b. 1865). She died in 1927 and according to her will, left 237 and 239 O St NW to her married daughter Alethya H. Williams, who used the property to borrow money from the American Security and Trust Company in 1934 and 1949. In 1966, Alethya sold the property to the District of Columbia.
A little thing about the will. One of the witnesses was named Ethel Witkowska, a very Polish sounding name. She lived at 21 Tea (T) St NE. She appears in the 1930 census as a 24 year old bookkeeper. According to the Social Security Death Index Ethel Witkowska was born March 1905 and died in 1974, so she was just 20 when she witnessed the will in 1925. Her name just stood out.
Another little thing about her will, is that she may have owned property in her native South Carolina. The property was in Sumter county. Since no town was mentioned, I’ll assume it was rural land.
Anywho, Susan Brown only appears in the 1920 census at that address. Susan E. Berry appears at 237 O St NW in the 1900 Census, living with her husband Hilyard/ Hilliard, a hotel porter, their sons Hilyard Jr (aka James Hilliard) and William and daughter Althea. A faulty family tree (there are a few errors) claims her maiden name was Ruffin.
Since I’m looking at the census for 1920 and her family owned the neighboring lot, let’s look at 239 O St NW. It was lot 819 or old lot 11 on Sq. 553. Susan Berry’s will had named both Alethya and Hilliard Jr. as beneficiaries for 239 O St. NW. And it is Hilliard Berry and his wife Jessie Gordon Berry mentioned in the land records, not Alethya. They borrowed several times from the Washington Loan and Trust Company and individually named lenders, in 1929, 1930, 1934, 1935, 1937, 1939, 1942, 1943, 1945, 1947, 1950 and 1953. The widow Jessie Berry sold the property in 1965 to Sylvia H. Miller, who then turned around and sold the property in 1966 to the DC government.
The Clarkes and the Stewarts lived at 239 O Street as renters. In total there were 11 people living at 239. Like their landlords, they too were African-American. The head of the Clarke family was Henry who was listed as being an Assistant Engineer. I should note that William Berry or Brown’s occupation in 1920 was that of an Engineer. William’s brother, Hilliard, in the city directory is some sort of Engineer in the DC Public Schools. According to a WWII draft card, Hilliard worked at Dunbar High School. I wonder if Henry Clarke and the Berry/Brown brothers worked together?
Gee, his name may as well be John Smith. Last post was Fannie Moore and I discovered there were a bunch of ladies with that name. I suspect I’ll have to weed through several Harry Browns.
In the 1920 Census then renter Harry Brown lived at 240 R St NW with his wife Rosetta and their 5 year old, Madaline. By the 1930 Census they are owners. There was a Harry Franklin Brown at 224 R St NW who filled out the draft card for World War I in 1917/1918. Since they were both barbers, I will assume they are the same person. I did not find Harry Brown in the Recorder of Deed records, but I did find Rosa E. Brown.
The address is on Sq. 551, which has been completely redone, so none of the houses on that block remain. The Library of Congress Baist map is of little help since it does not show 240 as a house number. But I can guess that it was lot L or 837 as it was the last house facing R St after 222 R St NW. This means it could have just as well been 224 R St NW. The owner for that lot was solely Rosa E. Brown. Harry, her husband appears nowhere on the paperwork. When she sells the property in 1959 to George Basiliko and his wife, she is listed as an unmarried widow. Rosa and Rosetta are the same person. Rosa Brown appears in city directories as the wife of Harry F. Brown at 240 R St NW.
From a family tree on Ancestry we find a fuller picture of Mr. Brown. He was born on July 19, 1889 in Baltimore, MD. His father was Maltimore Brown (1856-1924) and Helen (nee Cooper) Brown (1858-??) and he had a dozen brothers and sisters. Not in the family tree is the marriage in DC to Rossetta Blackwell in 1911. But an interesting thing in the family tree which creates a mystery. One of his many siblings is his sister Mary A. (1879-1970), who around 1902 married James Boardley. In 1910 the couple lived with a then single Harry, their parents and several other siblings at 1417 3rd St NW. In the 1940 Census, Harry is living with the Boardleys. No Rosa in sight. But according to the family tree, Harry died in 1937, which makes it hard to be in the 1940 Census. Rosa Brown was living back at 240 R St NW with daughter Madeline S. Brown, widowed and working as a maid. Why were Mr. & Mrs. living several blocks apart, if he was alive at all?
I decided to make my life a little easier and just look at the 1920 census for African American home owners. That’s because the Recorder of Deeds starts around 1920/1921 and looking at 1900-1910 property and landowners is harder.
Fannie Moore is listed as living at 53 O St NW in the 1920 census. Sadly, for me, 53 O St NW does not exist anymore. Google map puts it at an alley. Looking at a Library of Congress Baist map from 1919, 53 O St NW is on Sq. 616 lot 58. However, I have to take that with a grain of salt, because sometimes these address matches are a little off. The Recorder of Deeds record #1938036439, the only record for lot 58, confirms Fannie L. Moore as the owner. In 1938, it appears she sold the land to the DC government for $3,750.
It may seem odd, but Fannie or Fanny Moore was a common enough name that several show up, living in Washington DC in the early 20th century. And it didn’t help that her birth year was inconsistent. In the 1920 and 1930 census her birth year is estimated to be 1882. But in the 1900 census, when she was a 23 year old laundress, living with her mother and siblings at 51 O St NW, her birth year was 1877. With the city directory her address jumps around. In 1928 she is at 54 O St NW and in 1906 at 51 O St NW. So I do believe I have the same woman. But around the same time period is a Mrs. Fannie L. Moore married to a Thomas A. Moore and another one married to a C.E. Moore. Our Fannie Moore was a single lady.
The O St Fannie Moore may have started her career as a laundress, a common occupation for Black women at the time, but later found work with the US government. In city directories, at least by 1906, she had found a job with the Bureau of Engraving and Printing. At one point she was a shaker then moved up to become an operator, whatever those positions are.
Once she sells her property in 1938, she all but disappears. If I wanted to spend the money, as a federal employee I could research her personnel file. That would probably tell me when she departed this earth and if she ever retired or married (thus making it harder to find her). When she sold the property, she would have been around 61 years old.
My last post ran long and I felt I buried the lede. I’m just going to rehash it with a clique beatty title.
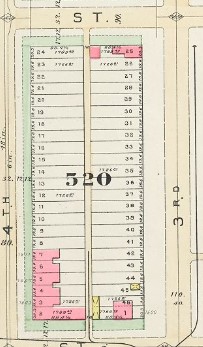
1909 Baist Map of Sq. 520
In 1905 the Miller ladies owned several lots on a city block in Washington DC. The square being Sq. 520, which sits between 3rd and 4th, R and Q Streets NW. The Miller ladies being Katharine Miller and her daughters Catherine, Agnes, and Anna. They were white women. According to the 1905-1906 General Assessment they owned under the names Katharine/ Katharina Miller, Catherine A. Miller, Anna B. Gaegler, and Agnes C. Sullivan lots 57-62, 65, 68, 74, 76-78, 86-88, 90-95, 102-106. Using the Library of Congress’ Baist map and Property Quest and trying to match addresses to lots with numbers that may or may not line up with current lot numbers, I think they owned 1603-1611 and 1629 4th, 1635 4th, 1641 4th, 1646 3rd, 1638-1642 3rd (empty lots), 1618-1622 3rd, 1602/4?? 3rd (empty lot 95), 1604-1614 3rd, and 304-312 R St NW.
Map from 1892
A lot of houses in DC say they were built in 1900. They weren’t. Several of these were. The map to the right is a Hopkins map from 1892. There are structures at the corner of 4th and Q and 3rd and R Streets that pre-date 1900. When looking at the 1900 census for residents in these Miller owned properties, they are all African American renters. Those older homes, 1603-1611 4th St NW, were owned by Millers but rented by the Turners, the Smallwoods, Motens, Dotts and others. They were Black laborers and domestics. But they also owned newer housing that did not exist in 1892 but did in 1900. These newer homes were 1629, 1635, and 1641 4th St NW.
Thomas Jenkins, a porter born in 1850, lived at 1629 4th St NW with his wife, 4 sons and three daughters. He and his wife Rachael were both born in Maryland. Their children were born in the District. His adult son William was a porter like his father. The second son Charles was a teacher. The third, Harry, was a bellman. The youngest, Thomas, was 10. His daughters appear to have been at home, unemployed.
There were 3 households at 1635 4th St NW. The first was a widow woman Cornelia E Madden. She is listed with a 2 year old daughter and a 17 year old son. The second is Sandford Madden, a 23 year old waiter. I don’t know if he was related to Mrs. Cornelia Madden. He is listed with his wife and their infant son, They also had two ‘boarders’ ages 3 and 4 in their home. Lastly there was William Washington, another young waiter in his early 20s. He lived at 1635 with his wife and their two year old son. Today the house boasts of having about 1500 sq feet.
1641 4th St NW also had three households listed as residents. First, there was 65 year old widow Ann Bowie with her 40 year old daughter Ella. Then there was 50 year old widow Louisa Brooks, a servant, with her 16 year old son Adolphus, a porter. Balancing out the widow women was Benjamin Stiles, a day laborer, He lived with his wife, Sarah, a washer woman and their 3 year old daughter. They had a male boarder, Richard Neale, a hod carrier.
I would examine their White renters from 1910 to see if they were crammed in as much as their Black neighbors, but this post is long enough.
The Recorder of Deeds website was being unhelpful. So this is mostly from Ancestry and the Historic Washington Post. Genealogy is hard. I refuse to do my dad’s side of the family because most of it could be summed up in the phrase, “Grandpa James shoulda kept it in his pants.” There are two James, two Roberts and two Johns. Families seem to like to recycle names, which makes things confusing and I was, and probably still am, confused by the Kat Millers of Sq. 520.
I mentioned Kat Miller, as I will call them, in an earlier post, Rando thoughts ending in a music video. For 1905-1906, on Square 520, which is bounded by R St, 3rd and 4th Sts, and Q Street NW, I saw a lot of Kat Millers as the owner of many lots. Katharine Miller owned lots 57-59, 62, 76-78, 88-86, and 90-91. Katharina Miller owned lot 92. Catherine A. Miller owned lots 60, 93-94, and 102-106. There was another lady Miller, Agnes R. Miller who owned lots 61, 65 and 95.
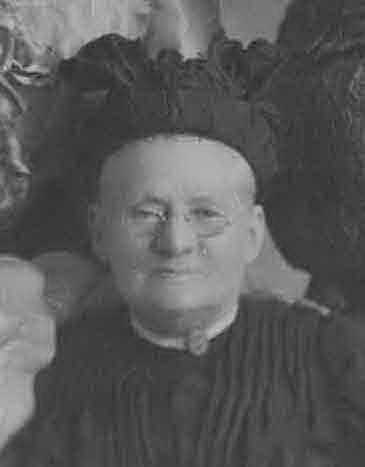
Katharina Nau Miller (1839-1916) Credit Ann Gaegler. Ancestry.com
Like my family, they reused the names. Katharina/ Katrina Elizabeth Nau Miller (1839-1916) was the mother. She was married to a John Miller and they used to live at 452 H St NW. They were members of St. Mary’s Catholic Church. They had three daughters, Catherine Appollonia (1871-1944), Agnes Rose (1878-1930), and Anna Barbara (1876-1950).
The Recorder of Deeds site (when working) helped with something that is very hard when looking up women, married names. Apparently Katharina had a will. I haven’t seen it but I’ve seen evidence of it. But according to land records there was a will and Catherine Appollonia Miller became Catherine Ruppert. She and her husband John Anton Ruppert (1861-1939) were the executors of Katharina’s will. In her will she left property to the surviving children of Agnes Rose Sullivan (lots 57, 78, 88, and 90) along with lots on Sq. 509 (maybe 509E?). In the September 16, 1916 Washington Post (p. 3) she left property and money to Catherine Ruppert, Agnes’ kids, and Anna Barbara Gaegler. Mrs. Gaegler owned lots 68 and 74 in 1905.
I’m not sure who John F. Shea is, but he was the surviving trustee of Catherine Ruppert’s estate.
1909 Baist Map of Sq. 520
Okay. Let’s see who these ladies were landladies for. I’m ignoring all the lots owned by Sullivans, who could be relatives of Agnes Rose. So let’s look at lots 57-62, 65, 68, 74, 76-78, 86-88, 90-95, 102-106. Not all the old lot numbers line up with the current lot numbers, and the Baist addresses can be wrong, so bear with me. 1603-1611 and 1629 4th, 1635 4th, 1641 4th, 1646 3rd, 1638-1642 3rd (empty lots), 1618-1622 3rd, 1602/4?? 3rd (empty lot 95), 1604-1614 3rd, and 304-312 R St NW.
In 1900 the residents of 1603-1611 and 1629 4th St NW were all African American. Basically everyone on Square 520 in 1900 was Black and renting and on 4th St NW. Unless I have another hole in my data (and I probably do), these white ladies had black tenants in fairly, newish houses. I live on the even side of the 1600 block of 4th St NW and the houses on the odd side are way bigger than the even side. They have room for parking. We don’t, for most of us.
Moving to 1910, I see I probably have a hole in my 1900 data because, I see White people. In 1910 the Miller ladies rented to African American and White families. Fourth St remains African American, but the R Street and 3rd Street houses are rented to White families. I have one odd-ball I need to check. A White man named Anthony A. Ryles of 1646 3rd St NW claimed to own the property in the census. 1646 is currently Mt. Sinai’s education center and the original lot 74, Anna Barbara’s lot, no longer exists. People lie, he could have bought it, or there is another logical explanation.
Okay. That’s enough researching for now.
Redlining vs Urban Renewal
I’m seeing the term redlining popping up more and more. Some of my relatives mentioned it during our Christmas Zoom gathering. It seemed new to the Festivus-like list of grievances that get trotted out by particular relatives, and it seemed to be short-hand for something else. I’m going to go with the simple definition of redlining being the denial of government backed mortgages to non-whites based on geography. Yes, redlining was bad, but urban renewal was much worse.
I’m tacking this on the end of the Kat Miller post because, I see that the landladies were interested in green, as they rented to both Black and White. Poking around the property and census records I see loans get made and a lot of people rent. In cities, you’re more apt to rent than own.
Urban renewal impacts both homeowners and renters, more so renters. It it easier to level a quadrant like Southwest when the majority of landowners don’t live there. The Northwest and later the Shaw School Urban Renewal Area plans were to knock out whole blocks, which would have displaced thousands of residents. In the plan, I-395 was supposed to continue up and meet up with U St, destroying what was to become my house in the process. The homes destroyed to make the freeways, the public parks and the low-income housing aren’t coming back. The scars of urban renewal are forever on the landscape.
Sources: Must login to DC Library's various database accounts-
https://www.ancestrylibrary.com/family-tree/person/tree/150627590/person/180246330315/Gallery?_phtarg=Kyj110
https://www.ancestrylibrary.com/family-tree/person/tree/150627590/person/180246330336/facts
https://www.ancestrylibrary.com/family-tree/person/tree/150627590/person/180246330337/facts
https://www.ancestrylibrary.com/family-tree/person/tree/120179064/person/222225869459/facts
"Oa.. .- '. .-.-... o Oo.-o-. o Oo o o 'o .o ; .-o--. o./o.'r' i. :-o" '-'Oo' " ' !! *o-1/2oo"-.o VY-^uuuuu.,Uu.uuuu>Uuuuu.-.Xuuc-*uuuuuu"-^r^^.^^ T Z .-',-. > Ooo .o o o ooo*o-,o Oo"- ..-.Oo; o..-o'.o "; o! District Gowrt Mews , ;i L____^___:_____I.1.... j-...-^;....'.-.:____." The Washington Post (1877-1922), Sep 16, 1916. https://search-proquest-com.dclibrary.idm.oclc.org/historical-newspapers/oa-o-oo-r-i-1-2oo-vy-uuuuu-uu-uuuu-xuuc-uuuuuu-t/docview/145505131/se-2?accountid=46320.
According to the 1900 Census Richard Thornton lived at 1520 3rd St NW. It’s the house with a porch in the middle of block where Bates St terminates, not the weirdo yellow house. According to the 1902-1903 Washington City General Assessment, he owned a lot of lots on Square 521.
But looking deeper it appears there are two Richard Thorntons, Senior and Junior. Going back to the 1880 Census we find the elder Richard R. Thornton (1835-1888/1898?) and the younger Richard Henry Thornton (1868-??) at 1520 3rd St NW.
There were a number of people at 1520 3rd Street in 1880. There were six people in the house: Richard, his wife Clara (nee Taylor, 1828-1913), their 3 daughters, Fanny, Patsy and Florence, and son Richard H. In 1900 Richard H. was the head of the family. He lived there which his 1st wife Vandelia (nee Copeland) and mom Clara, along with another household, George Green, his wife and daughter.
RR Thornton had several other properties on the block. In 1905 he (then a dead man) owned lots 4, 14, 18, 19, and 20. His son RH Thornton owned lots 15 to 17, which is odd, because 1520 3rd St NW is lot 17 on Square 521. Since many of the lot numbers have changed, I needed to go to the Library of Congress’ maps.
Section from Plate 33 of 1909 Baist map
On the General Assessment page lot 4 was split into a north and a south. They were both one coal yard. Lots 14 to 20 were Thornton owned. Looking at the map, according to the map notations lot 17 is 1522, so off by one. If the current addresses line up with some current and past lot numbers, then the Thorntons owned 1514-1526 3rd St NW. These were properties with renters and family members.
So around 1888 we all assume Richard R. died from the date of his will (req. logged in Ancestry Library). In the will he left 111 O St NW to his daughter Fanny Williams. His 2nd daughter Patsy Bradford got 1526 3rd St NW. His youngest daughter, Florence O. Thornton, was to get 1514-1516 3rd St NW after the death of her mom. Richard H. was to get 1520-1524 3rd St NW after the death of his mom Clara. That is what shows up in the 1905 General Assessment for Richard H. The properties for the female members seem to have gotten stuck in their father’s name.
But we’re not done with the last will and testament of Richard R. Thornton. On the 3rd page he mentions Grace Johnson, and describes her as, “(my daughter and wife of Dennis Johnson)”. I looked at Dennis Johnson in my last post. His wife Grace, shares the same maiden name, Taylor, as her mother Clara. I’m sure there’s an interesting story there. Grace was to get $300 from the sale of the coal yard.
I don’t know if Richard R. Thornton rented out the coal yard or ran a business from it or anything. His occupation on the census was “laborer”. Was he being modest? Looking at a 1887 city directory, he was running a laundry at 1514 3rd St NW. So in addition to the rental properties on 3rd St, he had a lot of things going on. When he left the world, despite not being able to read or write, he left property for his wife and children. Since he also served in the Civil War, it appears he left her a pension.
I know I’m supposed to kill my darlings when writing but I found something which makes me wonder what happened. Richard H. shows up on a Syracuse New York marriage certificate. In 1933 he’s a 61 year old chauffeur marrying a 47 year old domestic named Florence Van Alstyne. It was the second marriage for both. He had land. He was a landlord. I guess I’ll have to investigate.
I don’t think I have home ownership data for 1880. So I moved on up to the next census year where there was home ownership info, 1900. And it was here I found Mr. Dennis Johnson, who in 1880 was a laborer, in 1900, a teamster, and 1910 an “express man”. What’s an express man?
Interesting thing. All through the censuses 1880 to 1910, his address remains 1528 3rd Street NW, where he lived with his wife Grace (nee Taylor) Johnson. During certain years, they lived with their daughters Lena and Lulu, and nephew Horace Williams. By 1910 Johnson was in his 60s so he probably died before the 1920 census.
His daughter Lulu married a man named Washington Fitch and they lived at 1528 at least to 1935. She was a seamstress. Her husband was listed as a fireman in the 1930 census.
I found proof of Dennis Johnson’s ownership in the 1905-1906 General Assessment. He owned lot 13 on Square 521, which is the SSL number for 1528 3rd St NW. Looking at the Recorder of Deeds records, the earliest (they start in 1921) shows the widow Grace Johnson and her daughter Lula Johnson Fitch borrowing $500 in 1935 from the Washington Loan and Trust Company, later Riggs Bank. Lula/Lulu continues to use the property as collateral in the 1950s. I’m not sure what happened, because I don’t see evidence of her selling the property. There is some exchange in 1961, but Ms. Fitch is not a party.
Update: She probably wasn’t a party because she was very likely dead. I found this on the Court Listener site:
Gladys Jane Dial v. Charles W. Johnson, Administrator, Estate of Lula Johnson Fitch, Deceased, 259 F.2d 189 (D.C. Cir. 1958)
This opinion cites 1 opinion.
1 reference to Consolidted Electric Lamp Company v. James P. Mitchell, Secretary of Labor, International Union of Electrical, Radio and MacHine Workers, Afl-Cio, Appellee-Intervenor, 259 F.2d 189 (D.C. Cir. 1958)
Court of Appeals for the D.C. Circuit Sept. 18, 1958 Cited by 0 other opinions
Gladys J. Dial (1921-1993) was an African American woman who is currently at Arlington National Cemetery. According to Social Security info, her mother is listed as Lula B. Fitch but her father as James S. Vaughn. I don’t know what the story is there. Then there are these notes “Nov 1940: Name listed as GLADYS DIAL; Sep 1941: Name listed as GLADYS VAUGHN JONES; Aug 1946: Name listed as GLADYS VAUGHN; Apr 1967: Name listed as GLADYS JANE DIAL; 08 Apr 1993: Name listed as GLADYS J DIAL ”
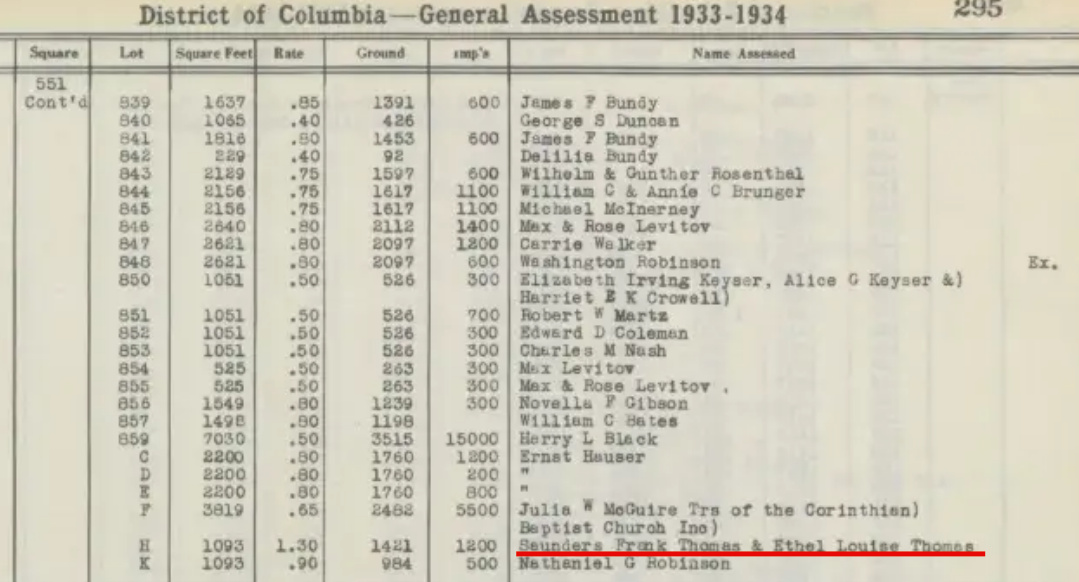
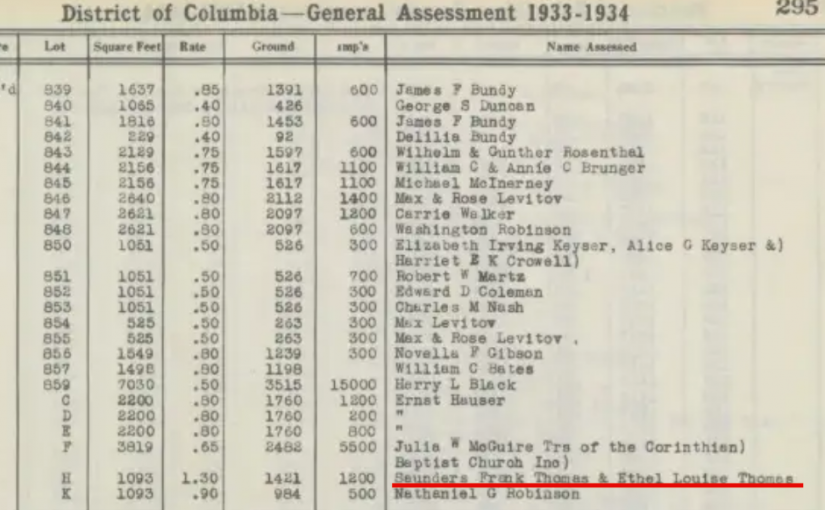
Last one in this particular series looking at the above segment of the General Assessment 1933-1934. I was not going to look at Ms. Julia W. McGuire, as she is in a trustee position. My dad is a trustee at his church (why. lord. why) and so his name shows up on the tax database for his county for his church’s parking lots. But another quick look at the Recorder of Deeds database showed that she transferred ownership to Corinthian Baptist Church July 23, 1931. I guess I’m looking up Ms. McGuire.
Mrs. Julia Wise (Grayson?) McGuire (1862- 1952), lived at 531 T St NW was the widow of Robert L. McGuire, and was an African American woman. That’s as much research as I want to do. I’ll write a bit about Corinthian Baptist Church. It was part of the 1957 Church Survey, so I have that link here.
Corinthian Baptist was at 3rd and Q before they moved to the unit block of Q. Corinthian Baptist at some point gave way to Ebeneezer Baptist. They sold their property to Mt. Sinai Baptist in July 23, 1948. The database says 7/20/1948 but that is definitely a 3 not a 0. Seems like July 23rd is a special date.
As you can see with your own eyes, the lots owned by the church managed to survive the urban renewal which created the Northwest Cooperative and Florida Avenue Park.
So today’s owner from the 1933-1934 General Assessment snippet for Sq. 551, the block the NW Co-op and Mt. Sinai sit, is Harry Black (1884-1945). According to the snippet he owned lot 859. But a search of the Recorder of Deed records show he owned lots, 144-148, 154 and 155, which he bought from Dennis Lawrence of NYC in 1931. He also bought lot 218 from Warren F. and Maud G. Brenizer in 1922. Then other lots, 156-157 from two separate people in 1926. Lot 182 from Allen C. Clark in 1927. Lots 149-153 from William and Adelaide E. Muehleisen.
So what do we know about this real estate mogul? Harry Leslie Black was born in MoCo, married to Nora Elliot (1881-1955), and as far as I can tell had no children. In the 1930 Census he’s a Dairyman, working for a dairy. So when he sells many parcels (more than listed above) of land to Fairfax Farms Dairy, Inc. it makes sense. He was listed as a proprietor in one census, so was he bought out? Was he planning on retiring from the dairy biz anyway? Was he an investor in Fairfax Farms Inc?
At one point the Blacks lived near Truxton Circle, in Bloomingdale, at 52 Adams Street NW. But sometime after Harry retired they were living way up near Friendship Heights at 3640 Fessenden St. NW.
We’re getting close to the end of this series. Well maybe a season. I will get back to Black Homeowners of the TC and focus on 1930 and 1940 home owners.
 Fannie Moore is listed as living at 53 O St NW in the 1920 census. Sadly, for me, 53 O St NW does not exist anymore. Google map puts it at an alley. Looking at a Library of Congress Baist map from 1919, 53 O St NW is on Sq. 616 lot 58. However, I have to take that with a grain of salt, because sometimes these address matches are a little off. The Recorder of Deeds record #1938036439, the only record for lot 58, confirms Fannie L. Moore as the owner. In 1938, it appears she sold the land to the DC government for $3,750.