The Washington Sanitary Improvement Company (WSIC) was a late 19th century charitable capitalism experiment that ended in the 1950s. This blog started looking at the homes that were supposed to be sold to African American home buyers, after decades of mainly renting to white tenants.
Looking at WSIC properties they tend to have a pattern where the properties were sold to a three business partners, Nathaniel J. Taube, Nathan Levin and James B. Evans as the Colonial Investment Co. for $3 million dollars. Those partners sold to African American buyers. There was usually a foreclosure. Then the property wound up in the hands of George Basiliko and or the DC Redevelopment Land Agency (RLA). Then there was the odd lucky ones who managed to avoid that fate.
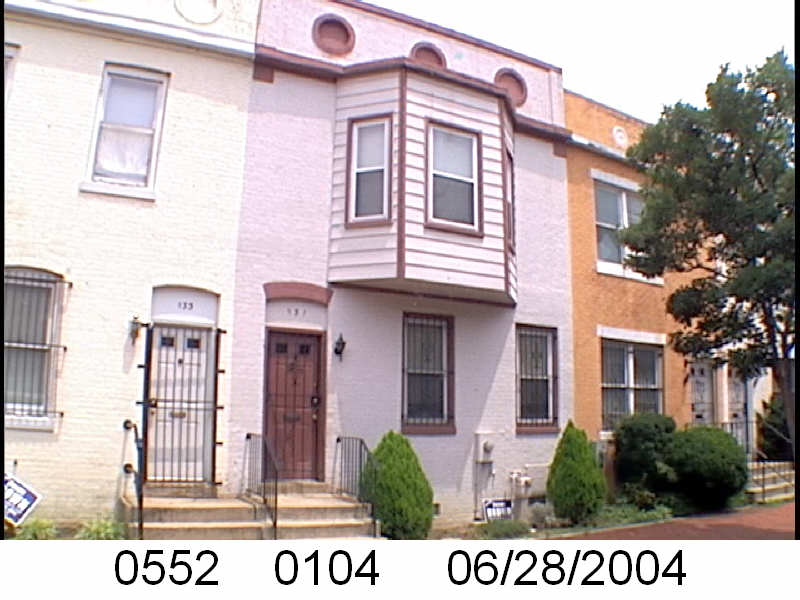
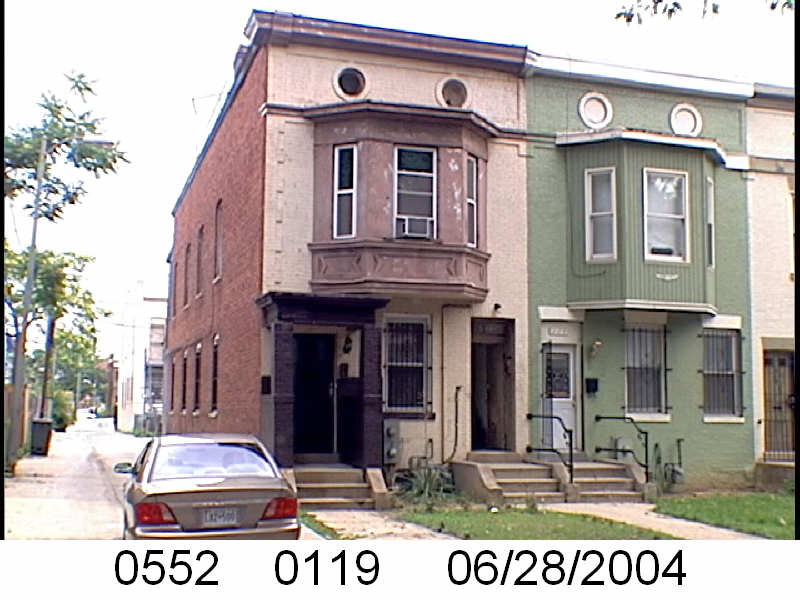
Let’s see what happens with 231 P St NW:
- January 1951 Evans, Levin and Taube sold 231 P St NW to James R. Veney.
- January 1951 Veney borrowed $6,750 from Colonial Investment Co. favorite trustees Abraham H. Levin and Robert G. Weightman.
- February 1954 Veney lost his home to foreclosure. The property returned to Evans, Levin and Taube via an auction.
- March 1954 Evans, Levin and Taube sold half of 231 P St NW to Howard L. Norris.
- March 1954 Norris borrowed $4,152.26 from trustees Abraham H. Levin and Robert G. Weightman.
- August 1954 Evans, Levin and Taube transferred the other half 231 P St NW to Lillian M. McGowan and she transferred it back to them in the next document.
- November 1961, as part of a larger property package, new partner Harry A. Badt, Evans, and Taube, and their wives, and the survivors of Nathan Levin sold their half of 231 P to Sophia and George Basiliko.
After that things get messy. I don’t like to look at these records past the 1980s and 1990s because that brings me ever closer to bumping into people I might have known. And it is just weird.
Basiliko, in the form of George Basiliko with wife Sophia, and George Basiliko Inc., had a couple of real estate documents between 1962 and 1978. December 1978 George Basiliko Inc sold his half of 231 P St NW to Lewis L. Washington.
June 1980 Norris added Patricia Butler to the deed. Propertyquest has Patricia Butler is the current owner….. Okay. I didn’t see when/how it came under one owner.
So let’s check our WSIC bingo card. Sale of half of the property, eventually, check. Foreclosure, check. Sale to Basiliko, check. Sale to DC Redevelopment Land Agency, nope.