I’m changing my Flickr account from paid to free and to do that I had to delete over 2000 images. Some of the images were transferred to this blog. The exercise did have me going down memory lane.
In 2017 two artists, Brian Bakke & Ira Tattleman, and myself had an exhibit in Truxton Circle called the Triangle Known as Truxton Circle. One of my exhibits showed the demographic changes to Truxton Circle from 1880-2010.
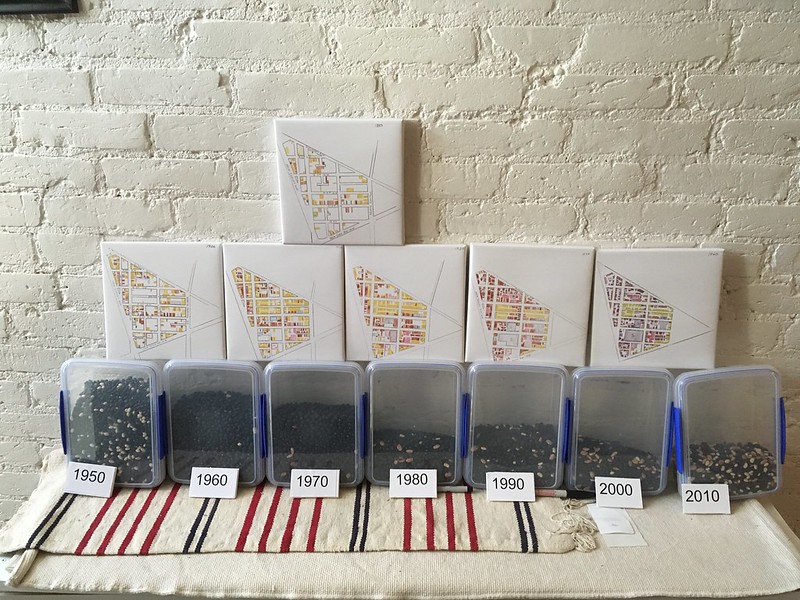 The drawings were of the filling out of the neighborhood. The top map was 1880. The following were 1900-1940.
On the maps, I took house by house information and colored white households with yellow; Black households with brown; government in blue with who they served filled in; and commercial properties in red.
The boxes of beans were to show the decline of the population. It was at its highest in 1940. The boxes had black beans for African Americans; Navy beans for Whites; and pinto for everyone else. The TC became a majority Afo-American neighborhood in 1930. You can see a lot of black beans in the 1950 box, along with speckles of navy beans. When WSIC sold off their rentals, those White renters left by the time the 1960 census rolled around.
As you can see the number of beans keeps decreasing year after year. And it isn’t until 1980 when the neighborhood starts seeing some racial diversity again.